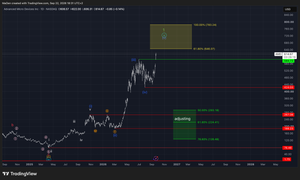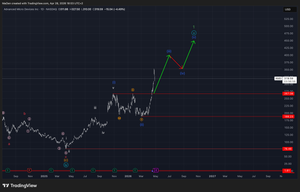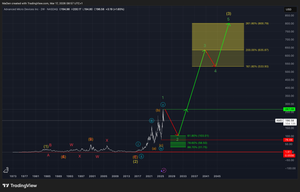
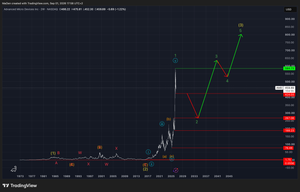
Over the past years, AMD has demonstrated a strong and well-defined market structure, building a solid long-term foundation with a clear Yellow Wave 1–2 setup. From there, the stock developed a powerful impulsive move, forming Green Wave 1 — the first major bullish fractal within the broader Green cycle.
This long-term cycle is expected to unfold through five impulsive waves, ultimately contributing to the development of Yellow Wave 3 within the larger overarching cycle.
However, every major bullish trend consists not only of upward movements but also of short- to medium-term corrective phases. These corrections are a natural part of the market structure and allow the broader trend to develop further.
Currently, we expect AMD to have established a major long-term high at its all-time high of $584.73, which we identify as the completion of Green Wave 1.
From this high, we expect AMD to correct the entire impulsive fractal that formed Green Wave 1. Our current primary scenario suggests that this correction could develop into an extended corrective phase, ultimately forming Green Wave 2.
If this structure plays out as expected, the completion of Green Wave 2 could provide the foundation for the next major bullish phase within AMD’s longer-term cycle.
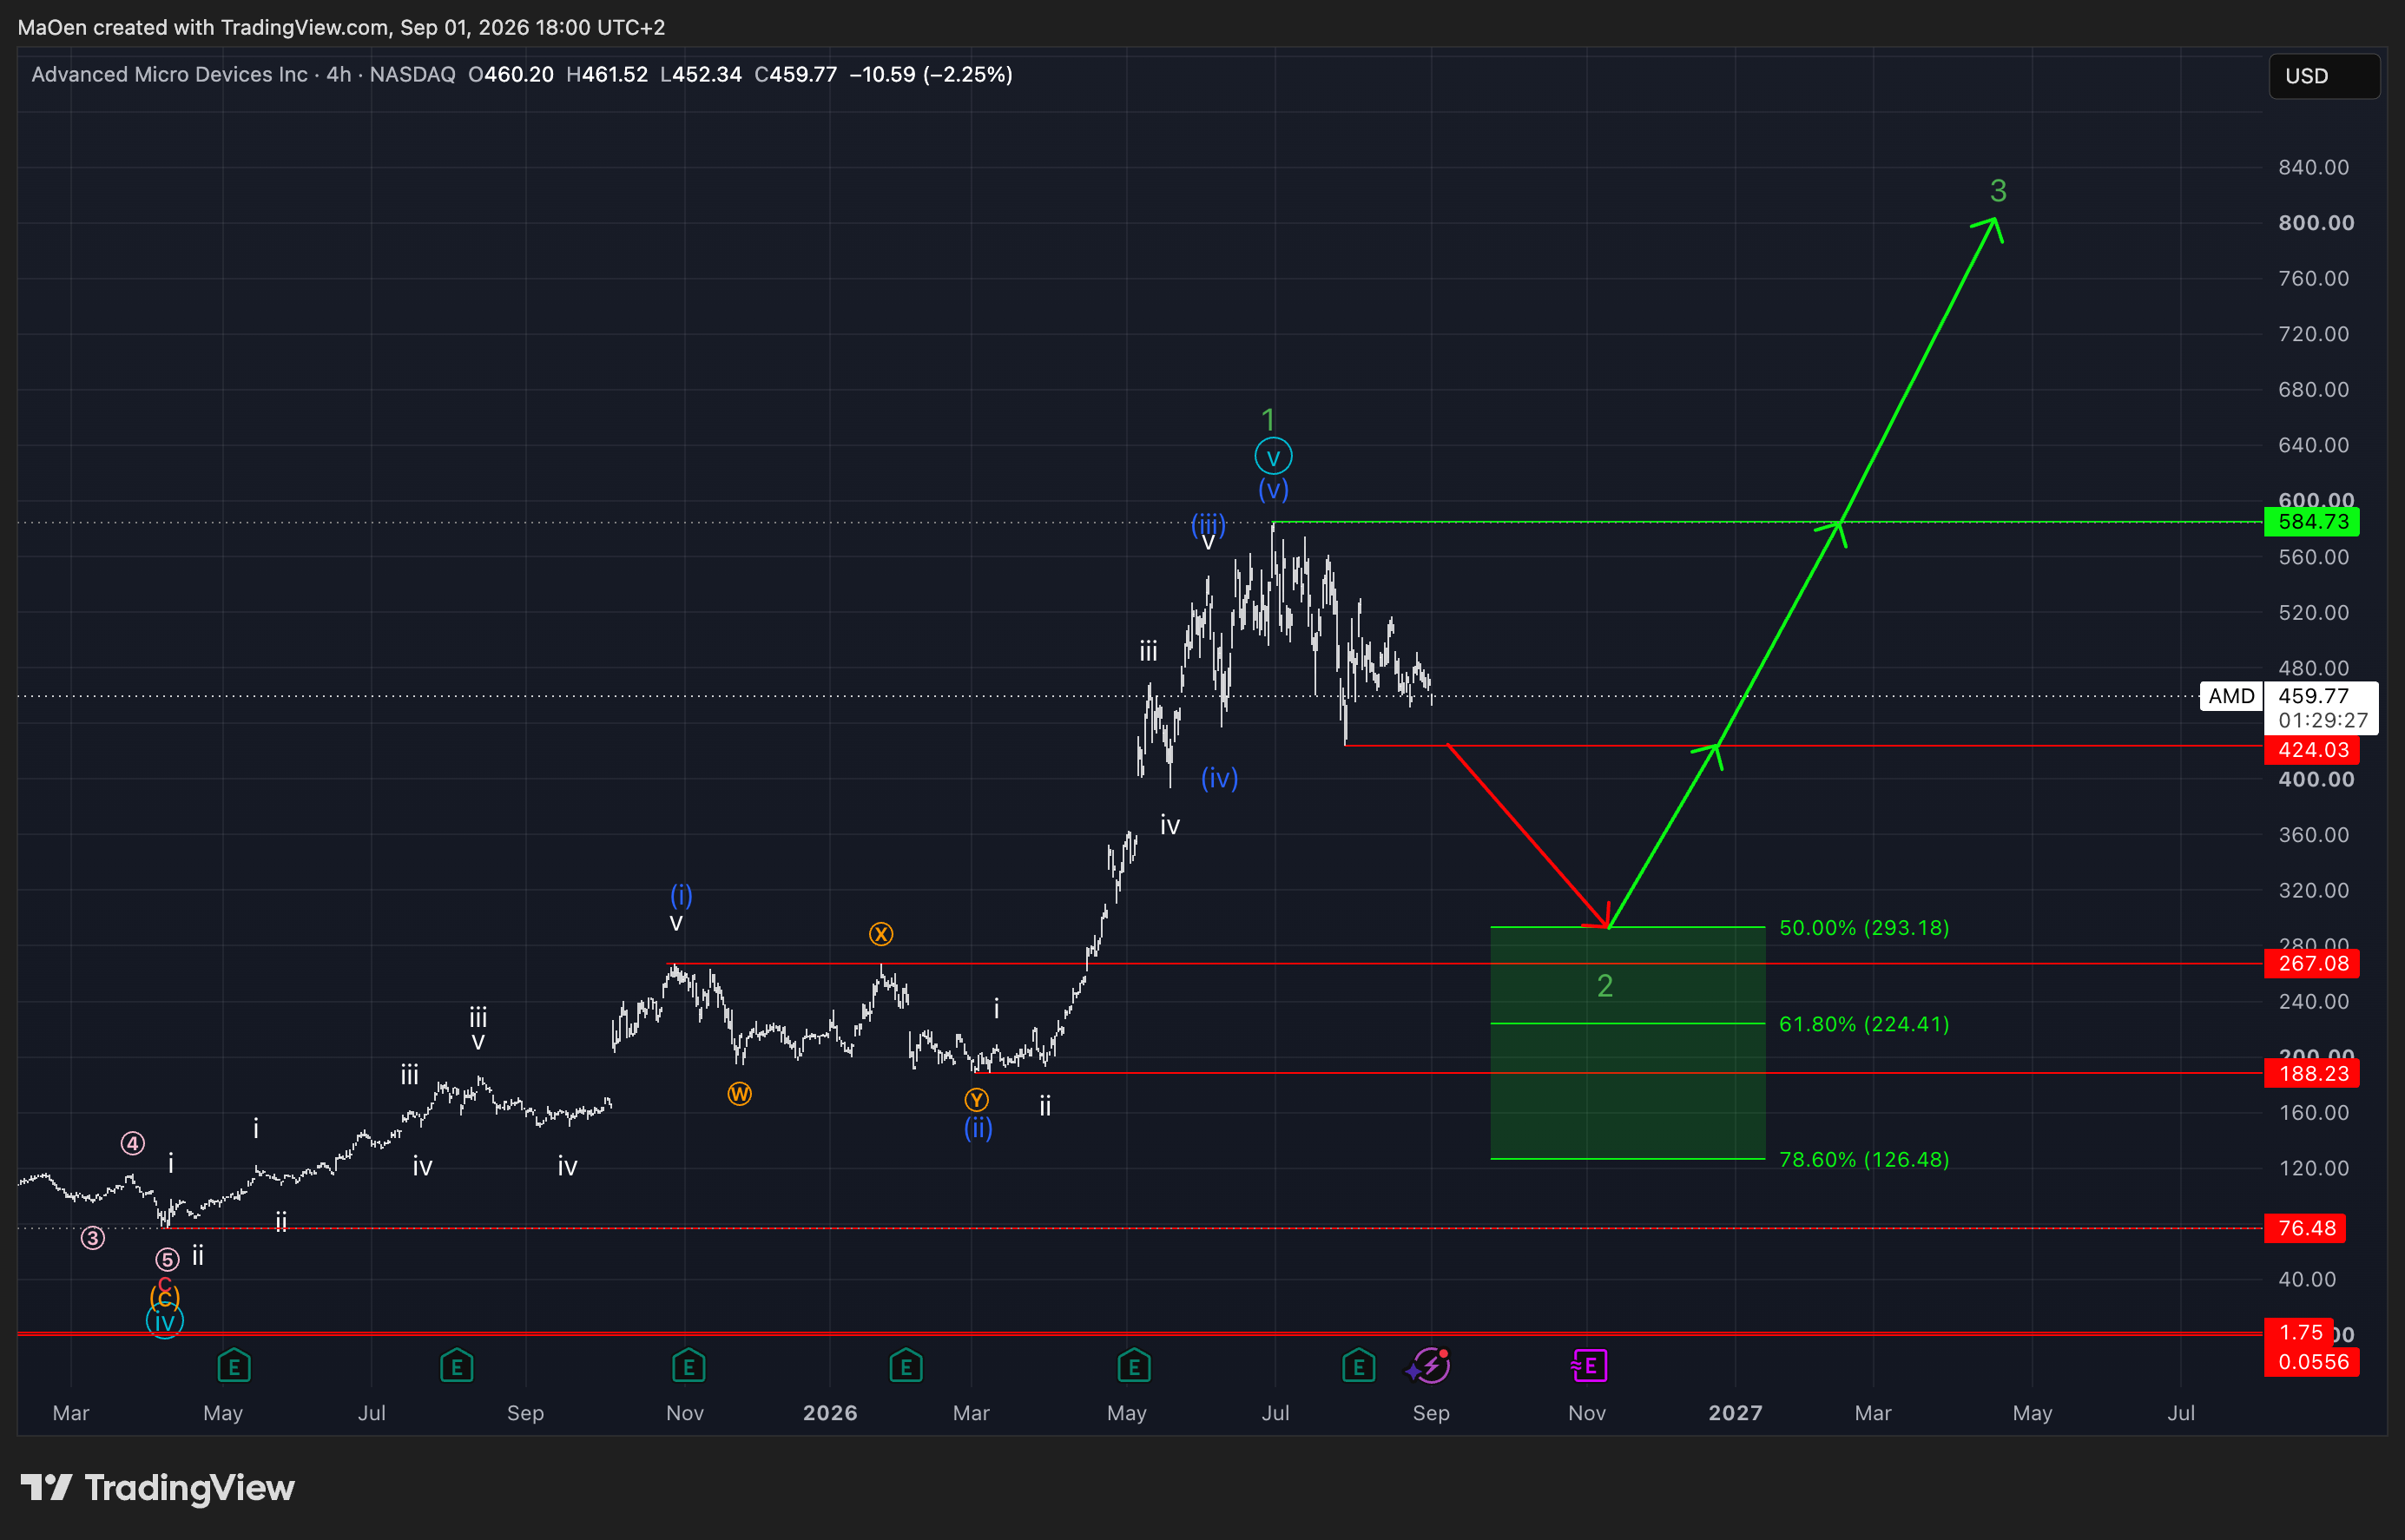
We expect that this correction has already begun and that AMD is currently still in the early stages of its first bearish movements.
To identify the potential area where this correction could come to an end and Green Wave 2 could be completed, we have established a Fibonacci retracement zone.
Long-Term Entry Levels
- 50%: $293.18
- 61.8%: $224.41
- 78.6%: $126.48
Stop Loss Level: 1% below zone at $125,20
This Fibonacci zone represents what we consider highly attractive long-term buying opportunities for AMD.
Should the stock reach these levels, each price area could offer the opportunity to build a long-term position at significantly lower prices. Based on our current Elliott Wave structure, we expect AMD’s broader bullish cycle to continue after the completion of Green Wave 2, with the potential for the stock to eventually move beyond its current all-time high.
Once our Fibonacci zone is reached and activated, and AMD approaches the potential end of its corrective phase, we will establish precisely calculated price targets for the next major bullish move.
We will closely monitor the structure and provide updates as the correction develops.
If anything significant happens with AMD, we will update you immediately.
Kind regards,
Monalytics
DISCLAIMER: The content on this website, including charts, analyses, and recommendations, is for informational purposes only and does not constitute financial, investment, or professional advice. Trading and investing involve risk. You should consult a qualified financial advisor before making any investment decisions.