Adyen NV (AYEN) EW-Analysis
The Last Chance Before the Run-Up
Since its IPO in June 2018, Adyen NV has formed a textbook initial bullish impulse. By completing yellow wave 1 followed by a corrective phase in yellow wave 2, the stock has established a solid foundation for a long-term uptrend.
We expect Adyen to gain significant bullish momentum over the coming months and years.
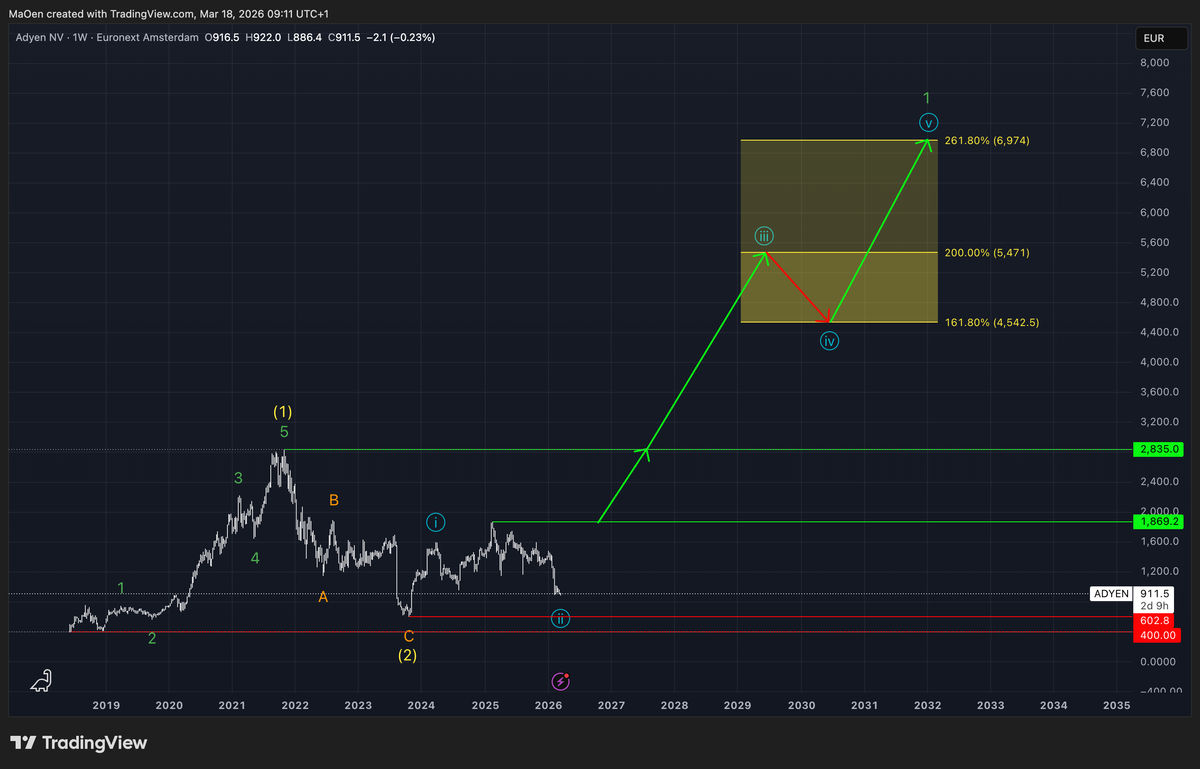
Yellow wave 1 marked the previous all-time high at $2,835, while yellow wave 2 established its low at $602.80. Following the completion of yellow wave 2, Adyen regained strong bullish momentum and initiated the first stage of the light blue cycle with light blue wave 1.
From there, the stock entered a short-term corrective phase into light blue wave 2, which is still ongoing. We expect that once this correction is completed, Adyen will resume its upward trajectory with sustained bullish momentum, expanding into light blue wave 3.
Light blue wave 3 is expected to push the price to new all-time highs, followed by a short-term correction in light blue wave 4, and then a final impulsive move in light blue wave 5. With the completion of light blue wave 5, the entire light blue cycle will conclude and form green wave 1 of a higher degree.
For the completion of green wave 1, we have projected a Fibonacci price target zone defined as:
- 161.8% at $4,542.50
- 200% at $5,471.00
- 261.8% at $6,974.00
This zone represents a potential target area where we expect the price of Adyen to move for the completion of green wave 1. However, this range should be treated as a guideline, as price action may extend beyond or fall short of these levels depending on future market dynamics.
At present, Adyen has completed light blue wave 1 and is trading within a corrective phase, forming light blue wave 2. For this phase, we have defined a Fibonacci retracement zone.
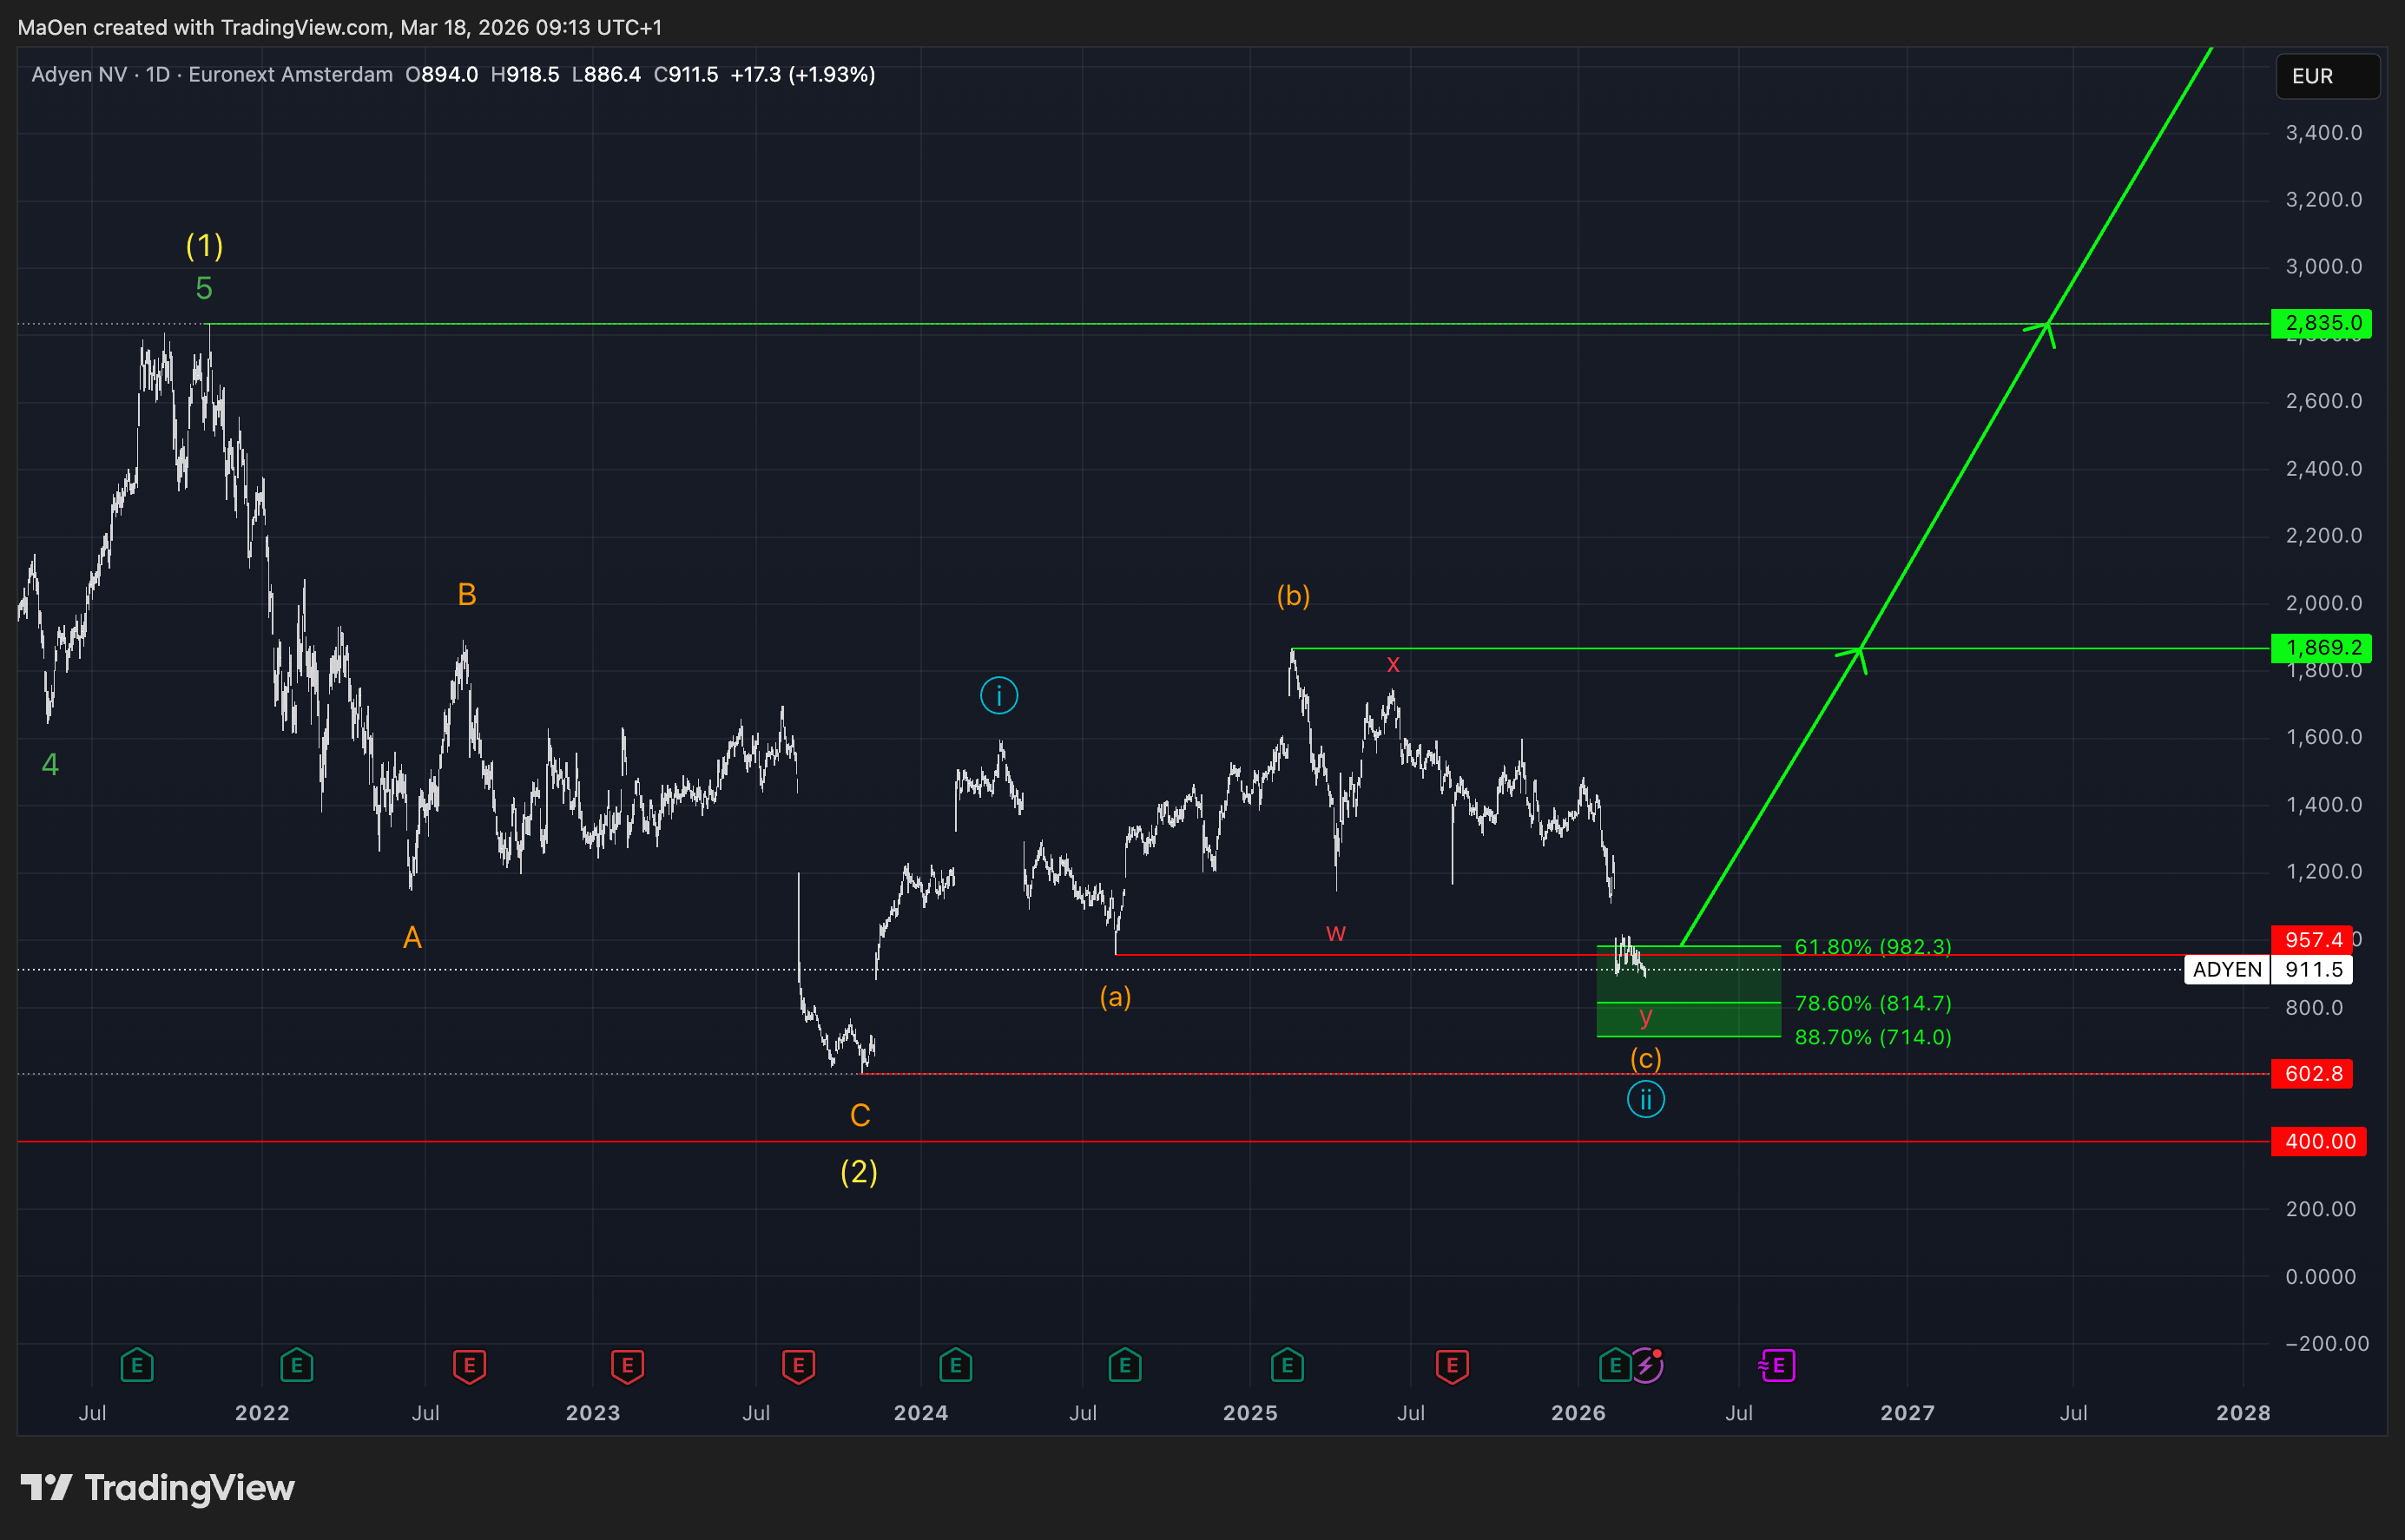
Adyen has already reached and activated our Fibonacci retracement zone. This zone is defined as:
- 61.8% at $982.30
- 78.6% at $814.70
- 88.7% at $714.00
From our perspective, this zone represents prime opportunities to buy or accumulate the stock. In the context of our long-term outlook, these levels offer a highly attractive entry.
We expect that over the coming weeks or months, Adyen should regain strong bullish momentum and move toward our local resistance level at $1,869.20. If our Fibonacci zone holds and the market advances to this level, we are confident in fully validating our long-term outlook and anticipating new all-time highs.
If any structural changes occur, or if Adyen leaves our Fibonacci retracement zone to the upside and thereby deactivates it, we will provide updates immediately.
Kind regards,
Monalytics
DISCLAIMER: The content on this website, including charts, analyses, and recommendations, is for informational purposes only and does not constitute financial, investment, or professional advice. Trading and investing involve risk. You should consult a qualified financial advisor before making any investment decisions.