Alphabet Inc. (Google) (GOOG) EW-Analysis
Google has entered a major correction.
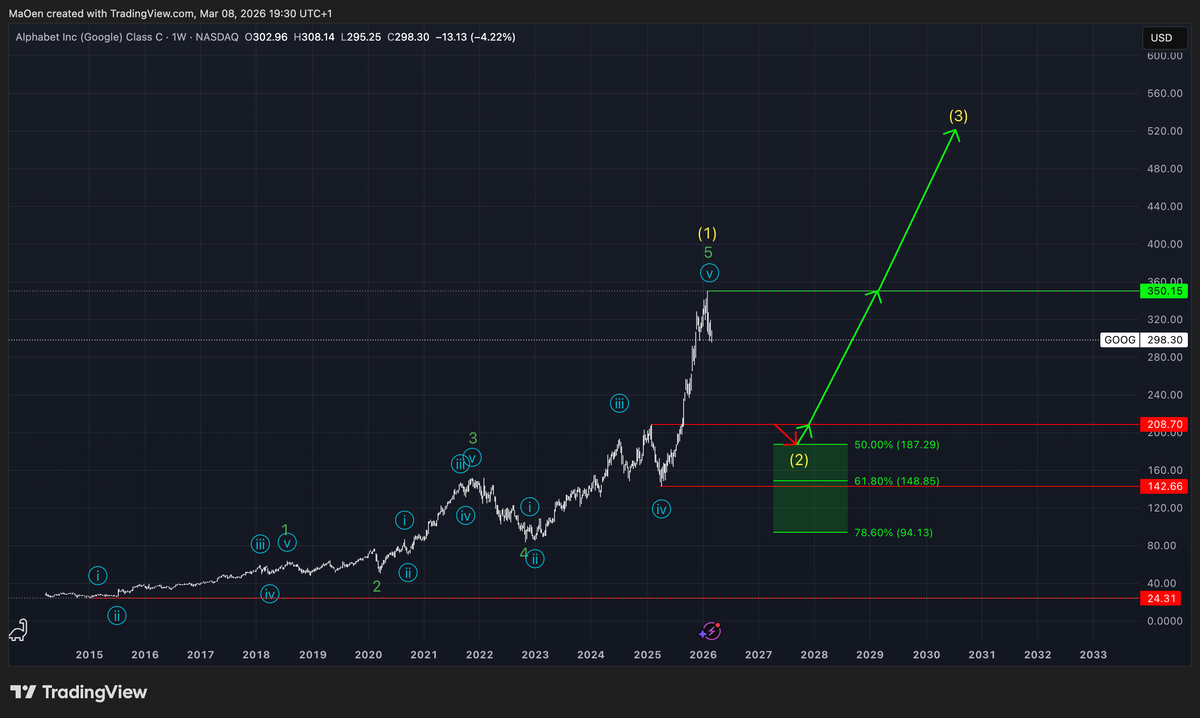
Since 2015, Google has been in a stable bull market, beginning with the formation of light blue Wave 1 followed by light blue Wave 2. From that point onward, the market established a sustainable uptrend and completed the light blue cycle and with that green Wave 1, followed by a bearish corrective phase forming green Wave 2. This green cycle laid the foundation for a long-term uptrend over the following years.
In the subsequent period, the market expanded rapidly into green Wave 3 with a strong impulsive movement, followed by a corrective phase into green Wave 4. After the completion of green Wave 4, the stock entered a massive bullish rally, repeatedly reaching new all-time highs.
However, we now expect that this rally has ended with the completion of green Wave 5, which also finalized yellow Wave 1. This yellow Wave 1 marks the current all-time high at $350.15.
From here, we anticipate that Google will enter a corrective phase to form yellow Wave 2 — the correction of yellow Wave 1. This suggests that the market has already topped and is beginning a short- to mid-term correction as yellow Wave 2 develops.
From a long-term perspective, however, we expect the market to regain strong bullish momentum once yellow Wave 2 is completed. At that point, Google could begin a new impulsive move into a powerful long-term yellow Wave 3, reaching new all-time highs and moving well beyond the current peak.
Based on this long-term outlook, we have identified a Fibonacci retracement zone where we expect the current correction to potentially come to an end. Within this zone, new bullish momentum could re-enter the market after the completion of the broader corrective phase.

This Fibonacci retracement zone ranges from:
- 50% at $187.29
- 61.8% at $148.85
- 78.6% at $94.13
From our perspective, this zone represents prime buying opportunities to either initiate or accumulate positions in this market. Based on our long-term outlook, this area could provide an ideal opportunity to maximize long-term buying positions in the stock.
If any structural changes occur or if our Fibonacci retracement zone gets activated, we will provide an update immediately.
Kind regards,
Monalytics
DISCLAIMER: The content on this website, including charts, analyses, and recommendations, is for informational purposes only and does not constitute financial, investment, or professional advice. Trading and investing involve risk. You should consult a qualified financial advisor before making any investment decisions.