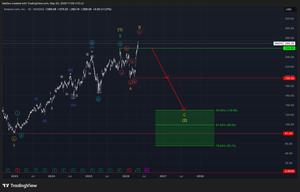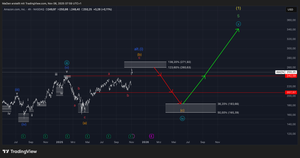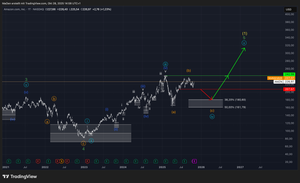
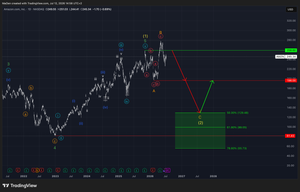
Amazon has created its major high and is still trading within its long-term correction. Following its initial sell-off, Amazon entered an impulsive recovery phase. However, this recovery is interpreted as a trap for bulls — counted as an overshooting wave B — which traps liquidity at new all-time highs. This typically leads to strong sell-offs, forming the final leg of the long-term correction. We identified Amazon as being in a correction some time ago and expect the market to drop drastically within this last phase of the overall corrective structure.
We have defined a Fibonacci retracement zone where we expect the market to terminate its correction and initiate new long-term impulsive movements with fresh bullish momentum.
Long Entry Levels:
- 50% at $129.48
- 61.8% at $99.05
- 78.6% at $55.73
Stop Loss: 1% below the zone at $55.17
This zone therefore represents long-term buying and accumulation opportunities for this stock at very discounted prices. For a blue chip, this correction is set to be significant.
Should anything change or happen with this stock, or once Amazon reaches and activates our Fibonacci retracement zone, we will update you immediately.
Kind regards,
Monalytics
DISCLAIMER: The content on this website, including charts, analyses, and recommendations, is for informational purposes only and does not constitute financial, investment, or professional advice. Trading and investing involve risk. You should consult a qualified financial advisor before making any investment decisions.