Amazon long-term EW-Analysis
This chart represents our primary long term expectations for Amazon.
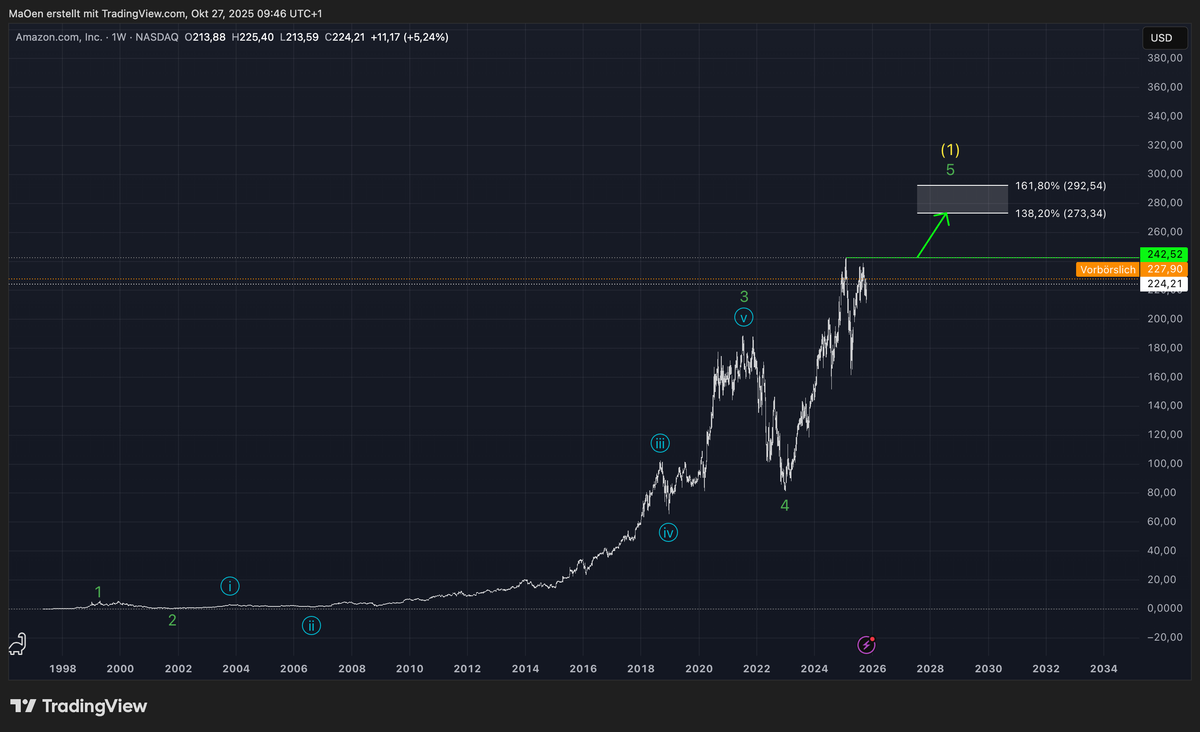
Since its launch in May 1997, Amazon has completed an exemplary long-term bullish Elliott Wave cycle (shown in green), which now appears to be approaching its terminal phase. The structure consists of a fully developed five-wave impulse — beginning with an initial Wave 1 advance, followed by a Wave 2 correction, and a strong, extended Wave 3. After the completion of Wave 4, Amazon now seems to be in the final stages of Wave 5 in green.
This five-wave sequence represents Wave 1 of a larger degree (in yellow), forming the foundation of a higher-order impulsive cycle. Once this long-term bullish advance concludes, we anticipate a corrective retracement in Wave 2(yellow) before the next major upward phase resumes.
We have identified a price target zone where Amazon could potentially complete its long-term bullish cycle. This zone lies between the 138.2% and 161.8% Fibonacci extension levels.
Trading Plan:
We expect Amazon to break above its current all-time high at $242.52, extending toward the Fibonacci expansion zone between $273.34 and $292.54. Within this range, we anticipate a potential completion of Wave 5 in green, marking the termination of the current bullish cycle and the onset of a higher-degree corrective phase (Wave 2 in yellow).
Once a confirmed top is established, we will outline the expected retracement targets for this forthcoming corrective phase.
This outlook reflects our primary expectation for Amazon`s long-term performance. Always ensure that you review our long-term projections first before moving on to our mid- and short-term Elliott Wave analyses.
(The content on this website, including charts, analyses, and recommendations, is for informational purposes only and does not constitute financial, investment, or professional advice. Trading and investing involve risk. You should consult a qualified financial advisor before making any investment decisions!)