Bitcoin – Long-Term EW-Analysis
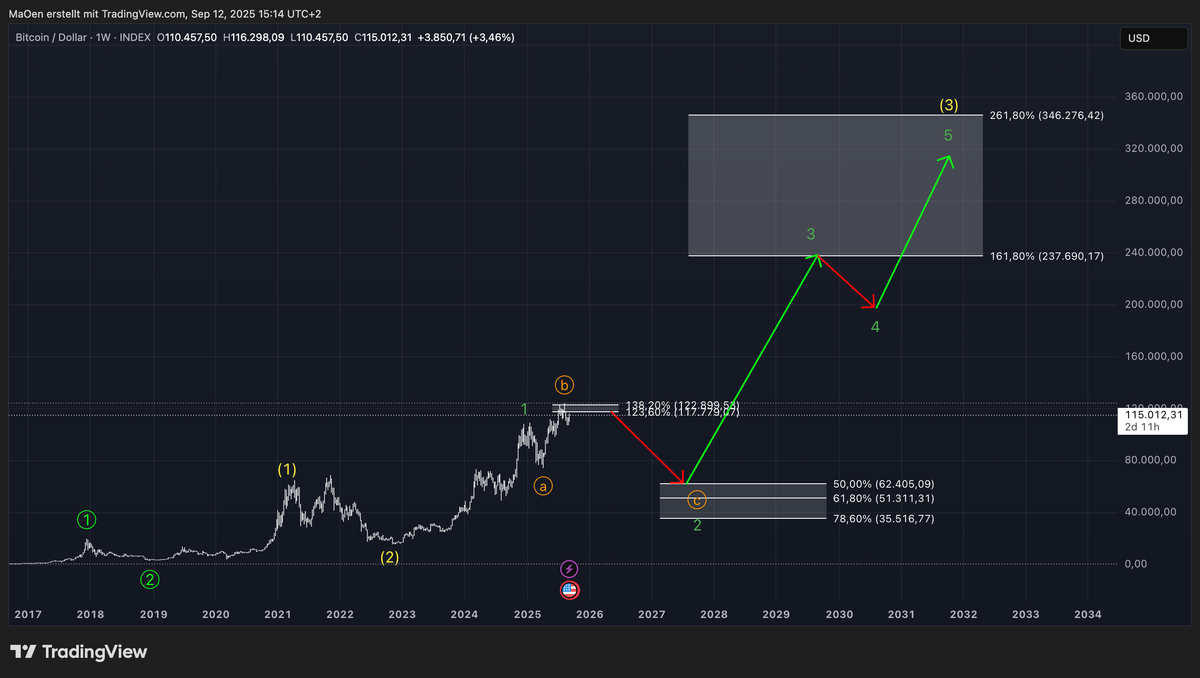
The chart illustrates our long-term outlook for Bitcoin.
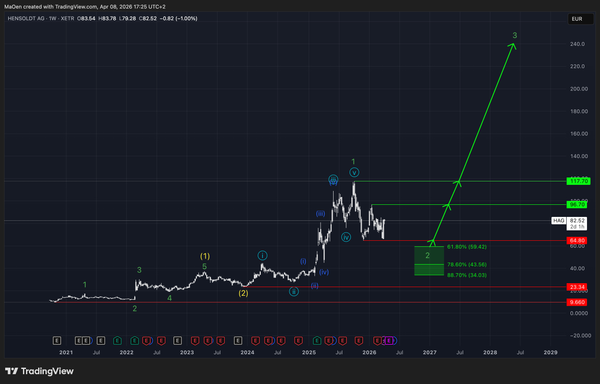
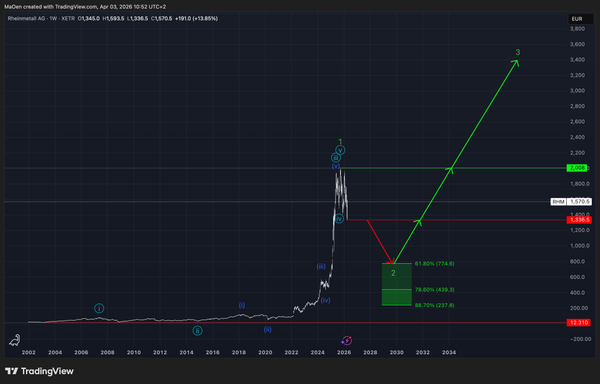
The 1, 2 structure in neon green marks the highest-degree cycle and serves as the foundational framework of our analysis. Nested within it, the 1, 2 sequence in yellow represents the next lower-degree cycle, which in turn unfolds into the powerful wave 3 of neon green.
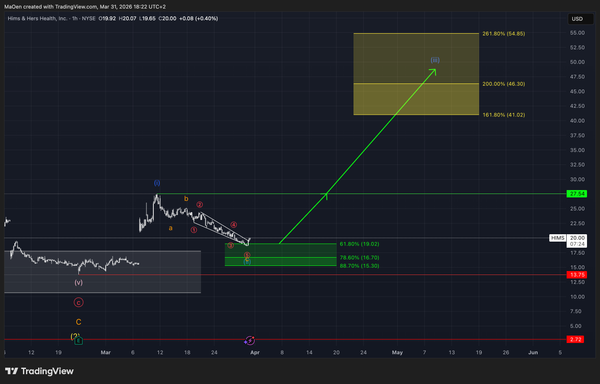
Within this structure, the green wave count outlines the anticipated five-wave subdivision of wave 3 in yellow. Based on Fibonacci projections, our target zone for this advance lies between the 161.8% extension at 237k and the 261.8% extension at 346k. This zone should be regarded as a guideline for Bitcoin’s potential valuation during the forthcoming yellow wave 3.
Current Trading Outlook
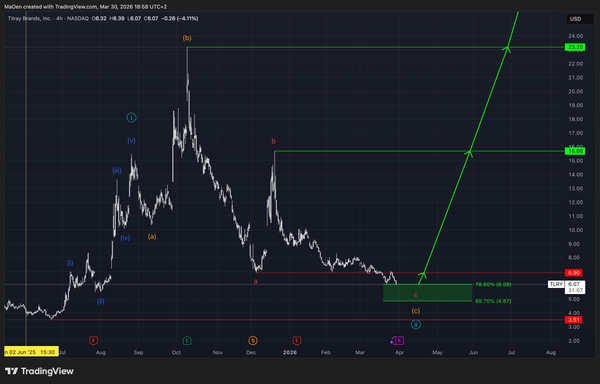
Bitcoin is not expected to rise in a straight line toward this target zone. Instead, we anticipate a corrective wave 2 in green to develop first, providing the necessary foundation for the subsequent impulsive advance into wave 3, followed by wave 4 correction and, ultimately, wave 5 in green — thereby completing yellow wave 3.
For now, our focus is on identifying favorable long-entry opportunities within the projected retracement zone of wave 2 in green. This zone spans the Fibonacci retracements of:
- 50% at 62k
- 61.8% at 51k
- 78.6% at 35k
This area forms the basis of our primary expectation for Bitcoin’s near- to mid-term price action.
(The content on this website, including charts, analyses, and recommendations, is for informational purposes only and does not constitute financial, investment, or professional advice. Trading and investing involve risk. You should consult a qualified financial advisor before making any investment decisions!)