Gilead Sciences (GILD) EW-Analysis
Is This the Final Top for Gilead Sciences?
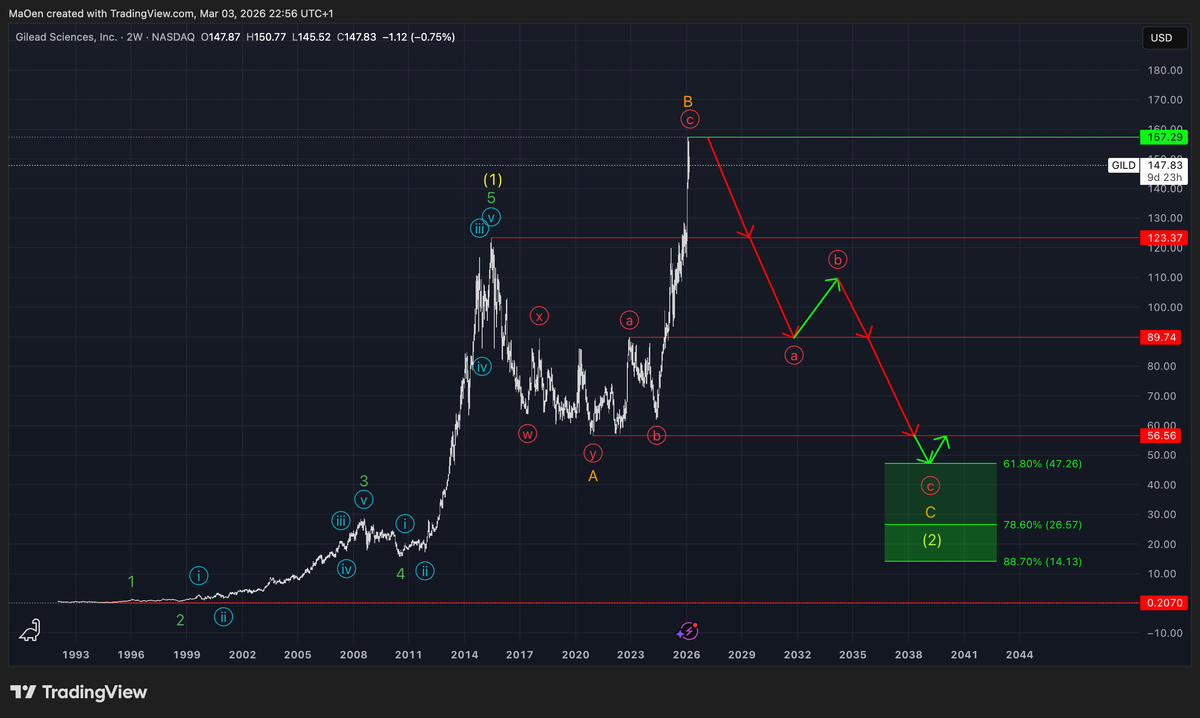
Since its IPO in January 1992, Gilead Sciences has established a long-term bull market and began forming bullish impulses early in its history. By developing bullish green wave 1 and wave 2 in August 1998, the stock initiated a sustainable rally that continued with the formation of green wave 3, followed by the corrective green wave 4.
After the completion of green wave 4, the market expanded significantly into the final bullish impulse of the green cycle, green wave 5. With the completion of this green cycle, yellow wave 1 was finalized, marking the end of the long-term sustainable bull market for the stock at $123.37.
Following the completion of yellow wave 1, the market began its first sideways sell-off, forming orange wave A, the first of three bearish waves that are expected to make up the long-term correction into yellow wave 2.
After completing orange wave A, the market regained bullish momentum and started a corrective rally into orange wave B. This move pushed the stock to new all-time highs. However, we interpret this rise as bearish in nature, viewing it as an overshooting wave B.
Overshooting wave B structures are often characterized by strong euphoria and optimism, but they frequently end in a sharp and brutal sell-off, forming wave C, which completes the entire correction.
We anticipate that orange wave B may have reached its end and that the market could begin the first bearish movements in the coming weeks or months, potentially leading to a major sell-off into our projected Fibonacci retracement zone.
Our projected accumulation zone lies between:
- 61.8% retracement: $47.26
- 78.6% retracement: $26.57
- 88.7% retracement: $14.13
This area represents a long-term opportunity to buy or accumulate the stock. Within this zone, we expect orange wave C to unfold and eventually complete, finalizing yellow wave 2 and thereby ending the entire correction.
Once this correction is complete, we anticipate strong and sustainable bullish momentum to return, potentially initiating the next major long-term bull run.
However, it is still possible that the current all-time high is not yet the final peak of the overshooting orange wave B, meaning that the market could extend slightly higher before the larger corrective move begins.
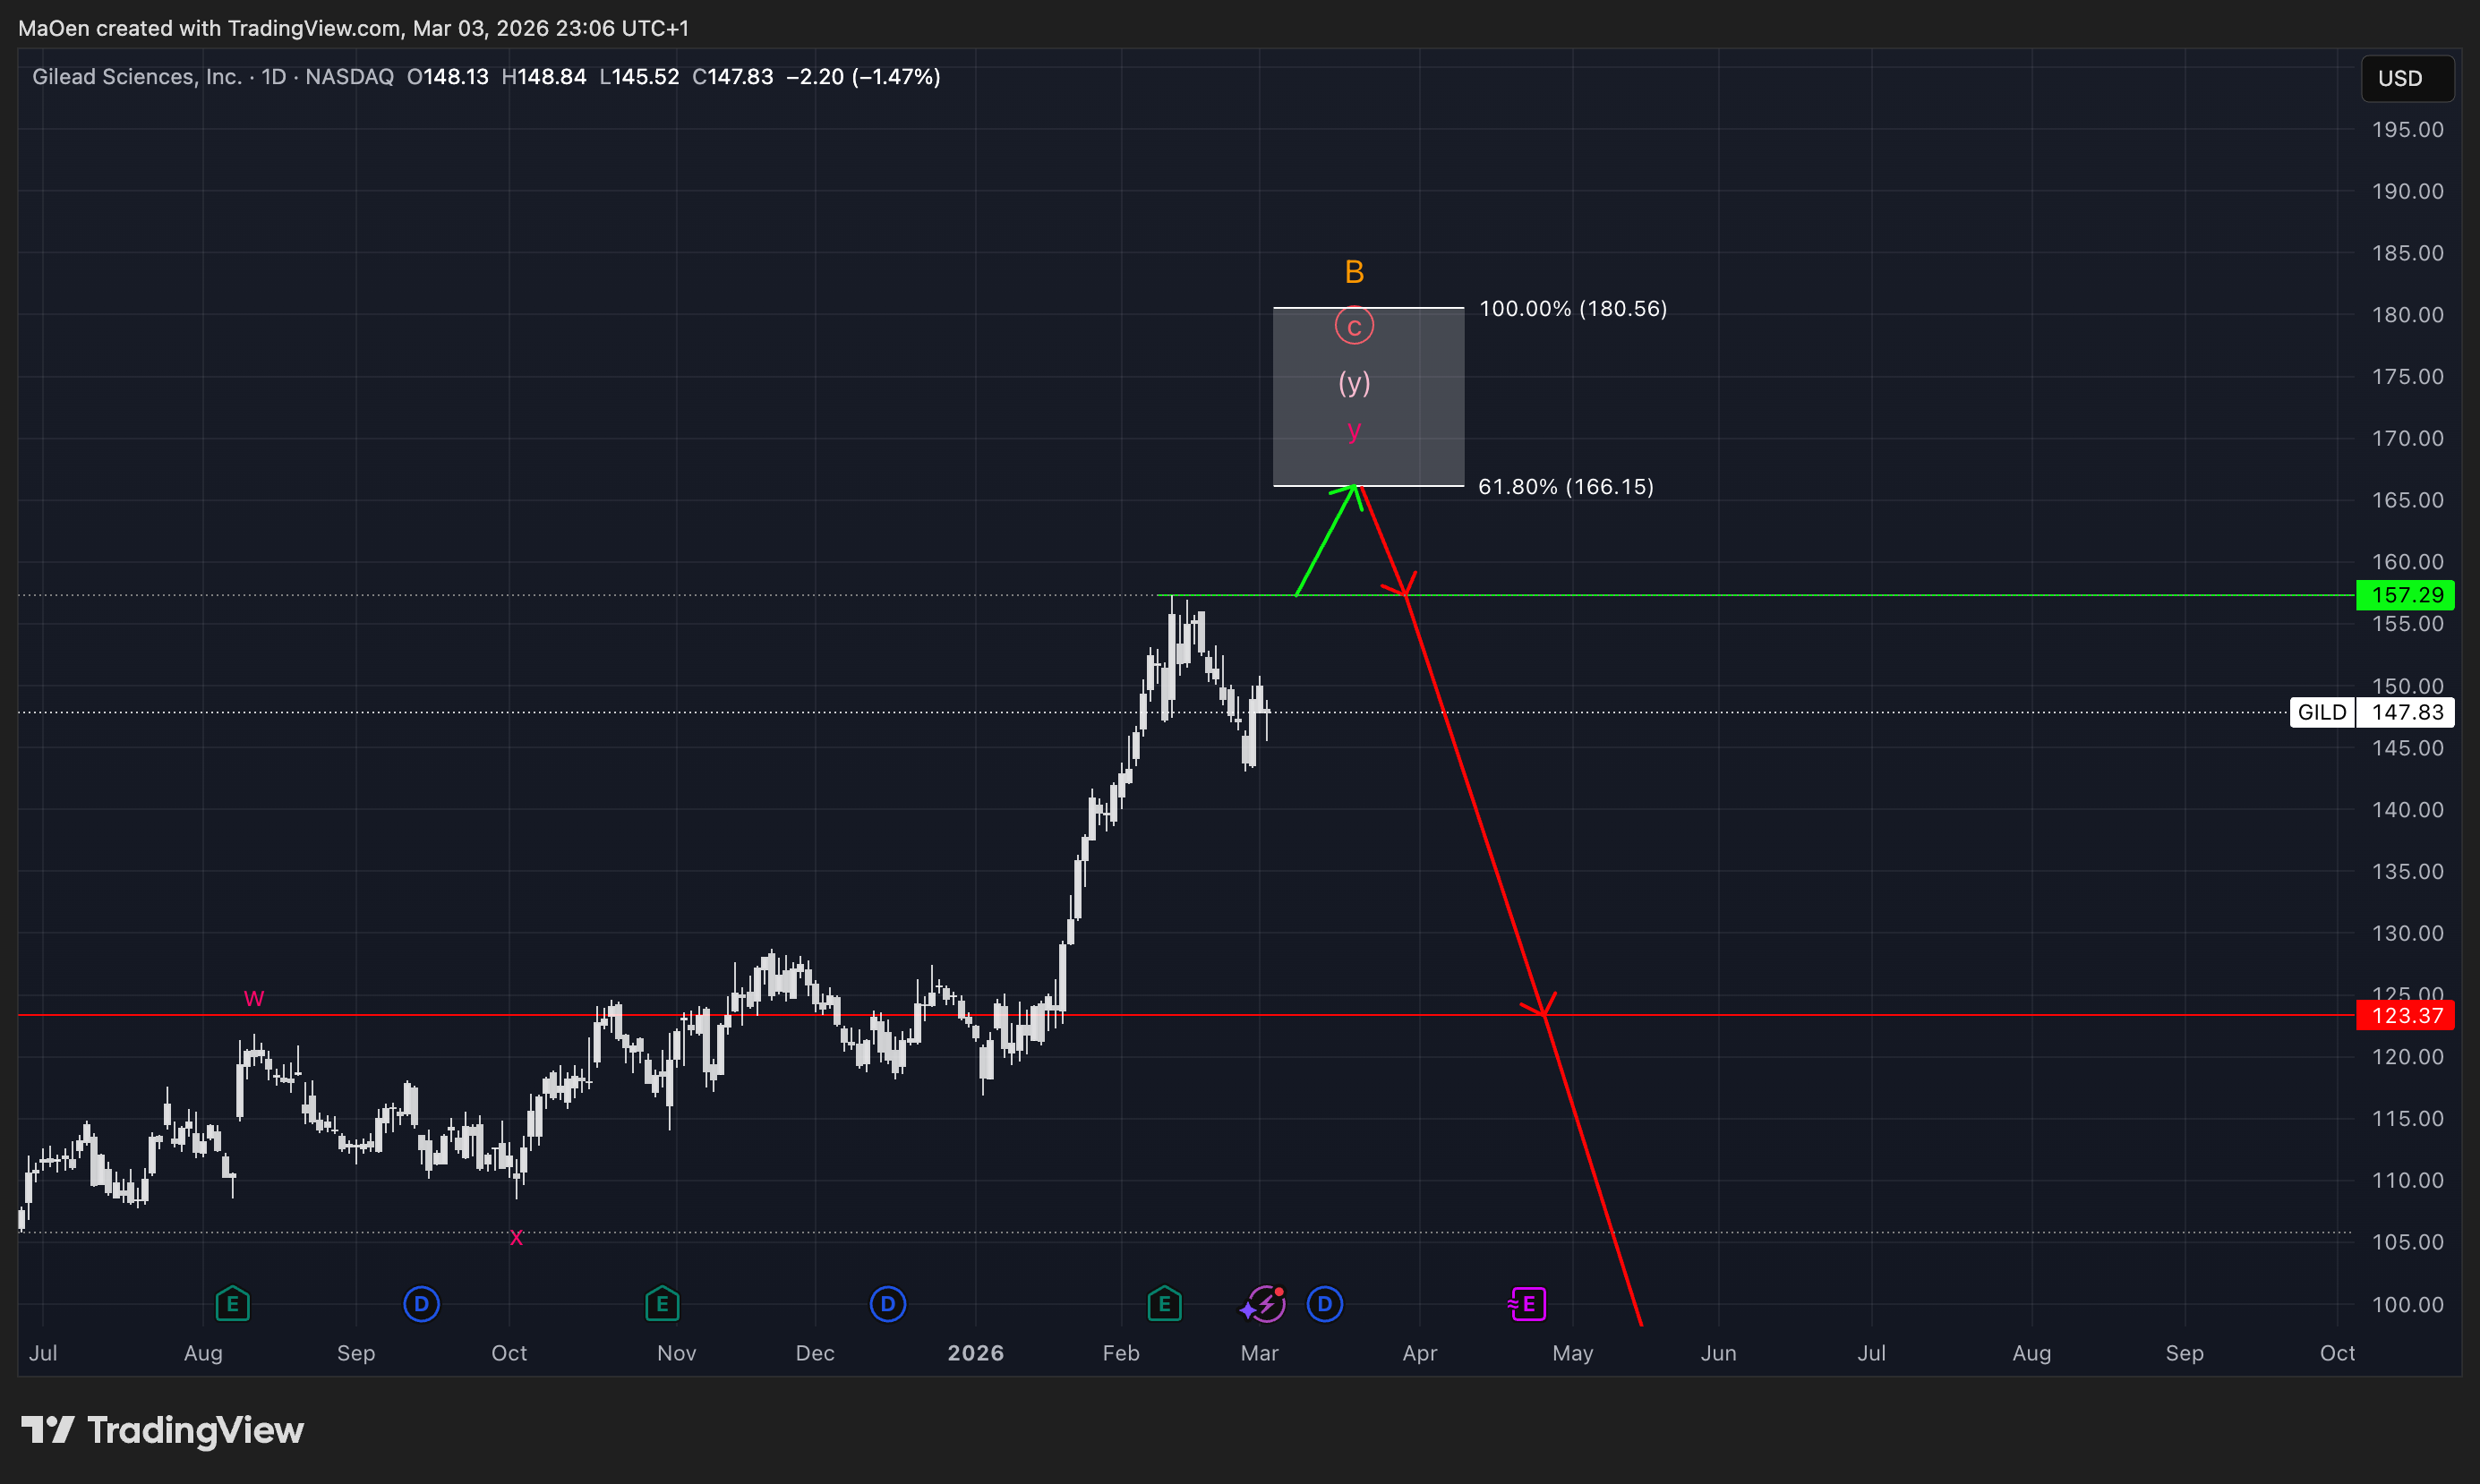
If this stock moves above its current all-time high at $157.29, we expect the market to reach our Fibonacci price target zone, which extends from:
- 61.8% at $166.15
- 100% at $180.56
If this scenario materializes, we expect the major high to form within this price target zone, marking the termination of orange wave B.
However, the exact level of the top is not our primary concern, as our overall scenario remains clear. We expect the market to complete this overshooting wave B and then initiate a major sell-off into orange wave C.
This decline is expected to reach our anticipated Fibonacci retracement zone, where the long-term correction should come to an end. From there, we anticipate the beginning of new long-term bullish impulses accompanied by fresh upward momentum.
If any structural changes occur — whether the stock reaches a new all-time high or confirms the current all-time high as the final peak — we will update you immediately.
Kind regards,
Monalytics
DISCLAIMER: The content on this website, including charts, analyses, and recommendations, is for informational purposes only and does not constitute financial, investment, or professional advice. Trading and investing involve risk. You should consult a qualified financial advisor before making any investment decisions.