Hensoldt AG (HAG)
A long-term opportunity.
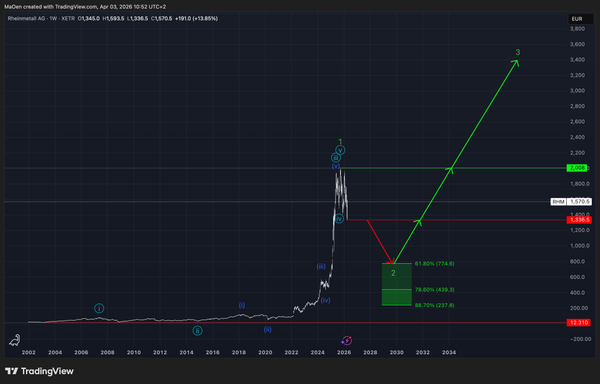
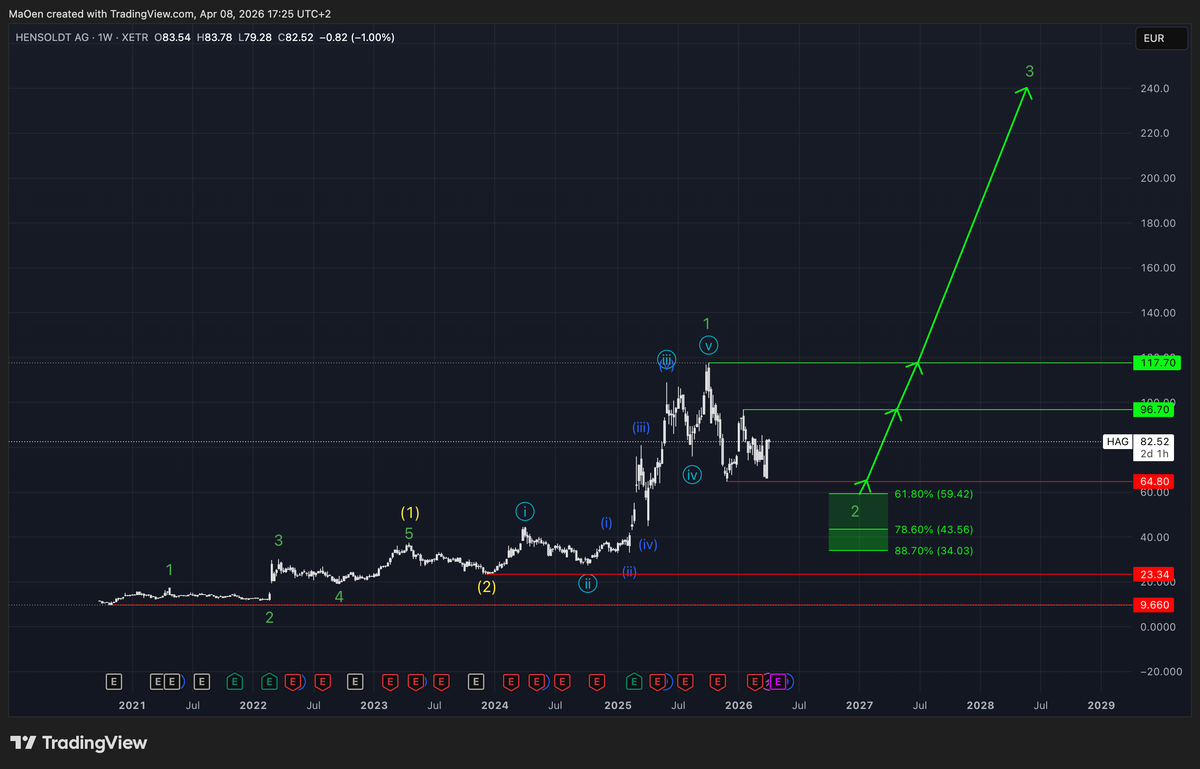
Since 2020, Hensoldt has shown a stable structural uptrend. In 2023, the stock formed its first major high, completing yellow wave 1, and then entered a corrective phase, forming yellow wave 2. This 1–2 setup establishes a long-term foundation for future structural bullish performance.
In 2024, Hensoldt completed yellow wave 2 and its corrective phase, then initiated a new long-term impulsive fractal with strong bullish momentum, forming green wave 1. We now expect that this impulsive phase has reached completion and that green wave 1 has been fully established.
At this stage, we anticipate the stock will enter a longer-term corrective phase, forming green wave 2, before resuming bullish momentum. This would lead into a new strong long-term uptrend, forming green wave 3.
This represents our long-term expectation for the market.
However, Hensoldt is currently trading within its corrective phase, forming green wave 2.
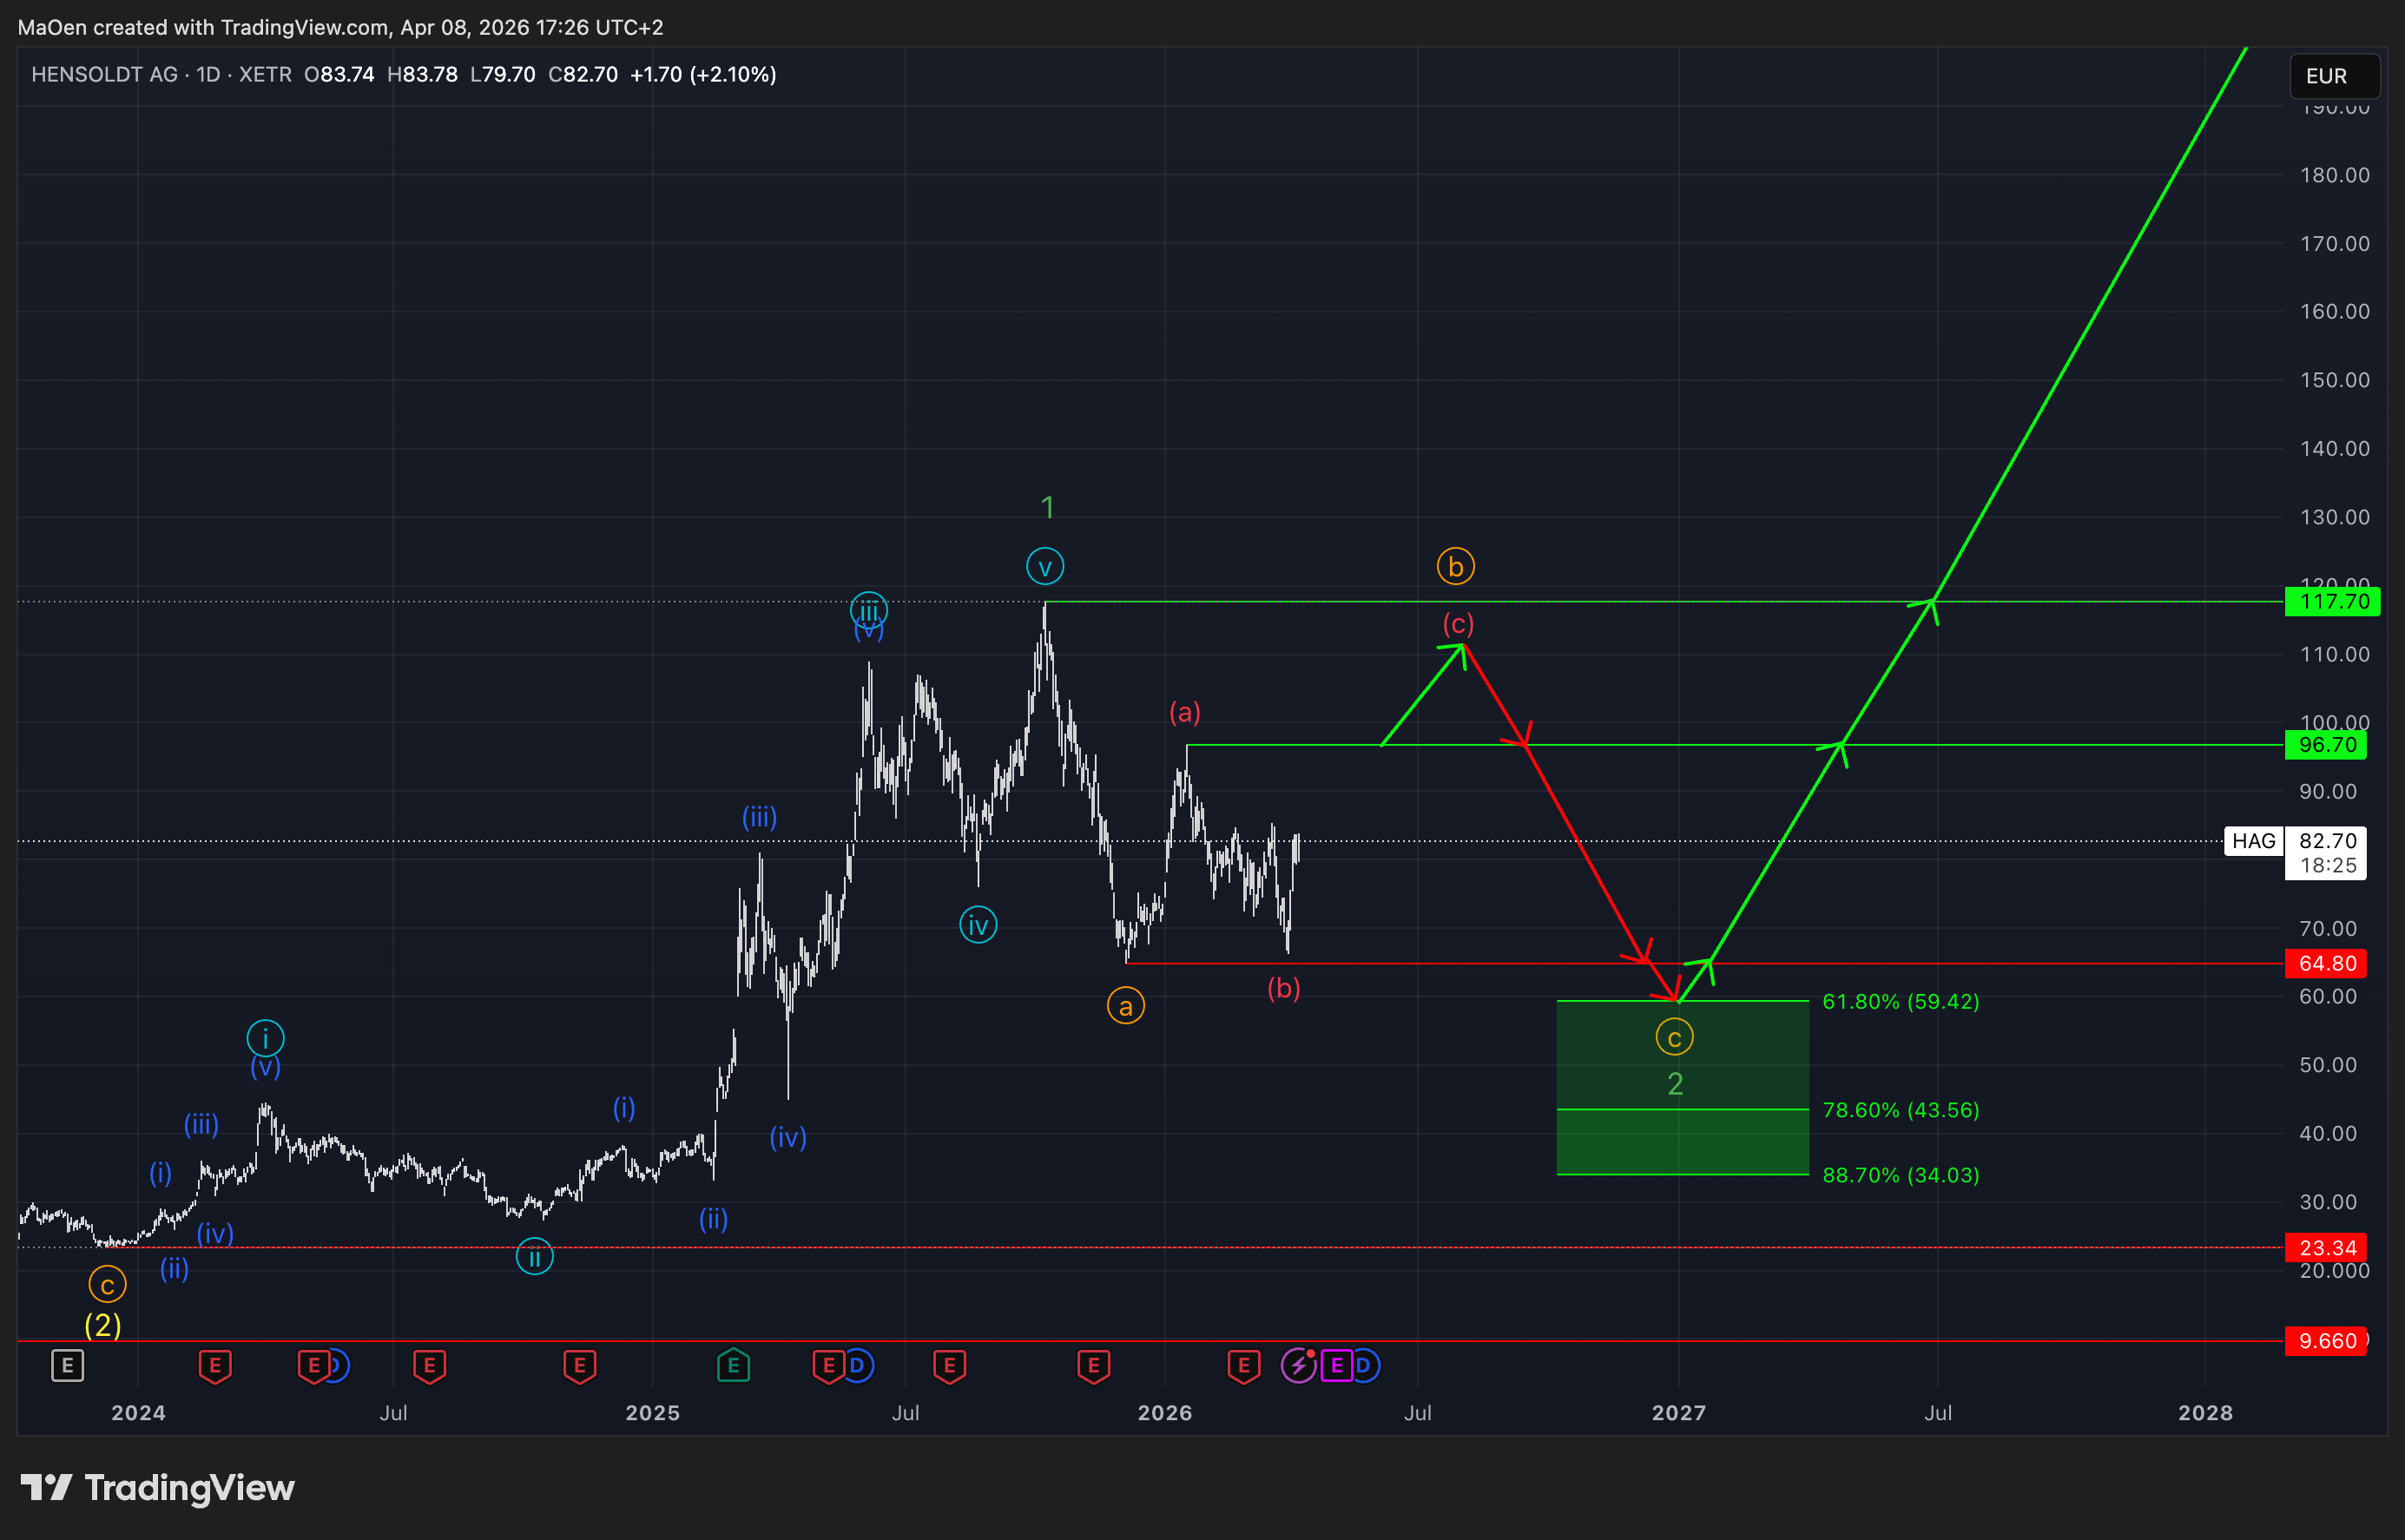
We expect this corrective phase to unfold in a three-wave structure: orange wave a, b, and c.
Hensoldt has already completed orange wave a, marked by the previous sell-off from the top at $117.70 down to $64.80. Following the completion of orange wave a, the market has now entered a recovery phase, forming orange wave b, characterized by short-term bullish momentum.
Once orange wave b is completed, we expect a final major sell-off to occur, with price likely dropping below $64.80 and entering our defined Fibonacci retracement zone. This move would mark the completion of orange wave c and, consequently, green wave 2.
This Fibonacci retracement zone ranges between:
- 61.8% → $59.42
- 78.6% → $43.56
- 88.7% → $34.03
Within this zone, the market is expected to terminate green wave 2 and align with our long-term expectation of a new structural uptrend.
From our perspective, and based on this outlook, the Fibonacci retracement zone represents an attractive opportunity to buy or accumulate the stock.
If any structural changes occur, or if Hensoldt enters and activates our Fibonacci retracement zone, we will update you immediately.
Kind regards,
Monalytics
DISCLAIMER: The content on this website, including charts, analyses, and recommendations, is for informational purposes only and does not constitute financial, investment, or professional advice. Trading and investing involve risk. You should consult a qualified financial advisor before making any investment decisions.