Infineon Technologies (IFX) EW-Analysis
Infineon Technologies reaches new highs before a major breakdown.
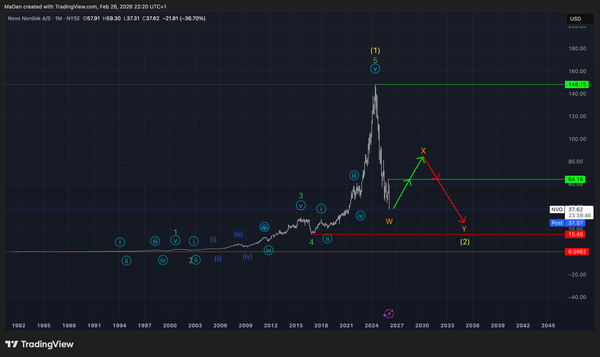
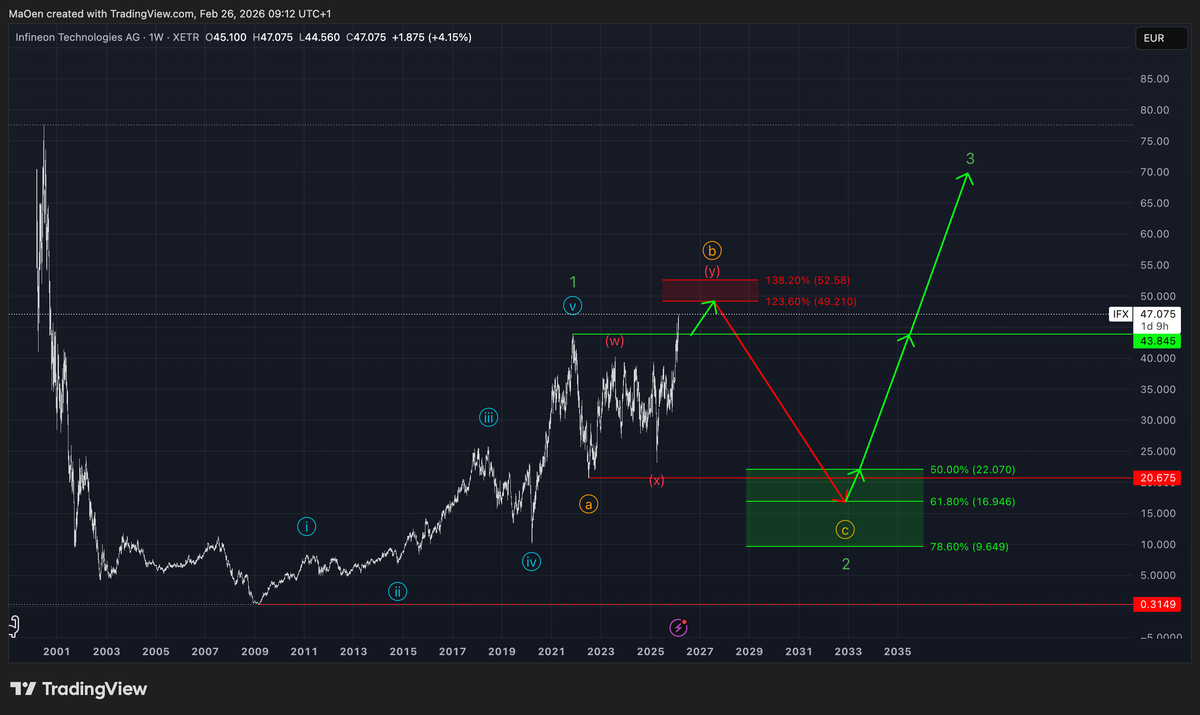
Since its IPO in 2000, the Infineon stock found its bottom at $0.31, representing a decline of approximately 99.48% from its previous all-time high.
However, in 2009 the stock regained new impulsive bullish momentum and formed a bullish uptrend within the Light Blue cycle.
In 2022, the Infineon stock completed the Light Blue cycle with Light Blue Wave 5 and thereby formed Green Wave 1 of a higher-degree cycle. This Green Wave 1 marked the local high of the entire bull market since 2009 at $43.84.
After the completion of bullish Green Wave 1, the market initiated its first sell-off, forming the beginning stage of the corrective phase into Green Wave 2. This first sell-off can be identified as Orange Wave a.
From there, the market regained bullish momentum and is currently forming an overshooting corrective Orange Wave b.
For this overshooting Wave b, we have defined a Fibonacci shorting zone in which this wave should come to an end and lose bullish momentum.
Fibonacci Shorting Zone:
- 123.6% at $49.21
- 138.2% at $52.85
Within this zone, corrective Orange Wave b should complete, and the first bearish movements should be initiated again to form a major sell-off into Orange Wave c. This would mark the end of the entire correction and complete Green Wave 2.
From our point of view, this shorting zone represents an opportunity to sell or short the stock.
For the end of this correction, we have also defined a Fibonacci retracement zone where new long-term bullish momentum should re-enter the market, completing bearish Green Wave 2.
Fibonacci Retracement Zone:
- 50.0% at $22.07
- 61.8% at $16.94
- 78.6% at $9.64
This zone represents, from our point of view, a strong opportunity to buy or accumulate the stock at each Fibonacci level.
From this zone onward, we expect the Infineon stock to start new bullish impulses into Green Wave 3 and, from a long-term perspective, reach new highs and potentially new all-time highs.
If any structural changes occur or if one of our Fibonacci zones becomes activated or invalidated, we will update you immediately.
Kind regards,
Monalytics
DISCLAIMER: The content on this website, including charts, analyses, and recommendations, is for informational purposes only and does not constitute financial, investment, or professional advice. Trading and investing involve risk. You should consult a qualified financial advisor before making any investment decisions.