Merck KGaA (MRK) EW-Analysis
Where is the end of this correction?
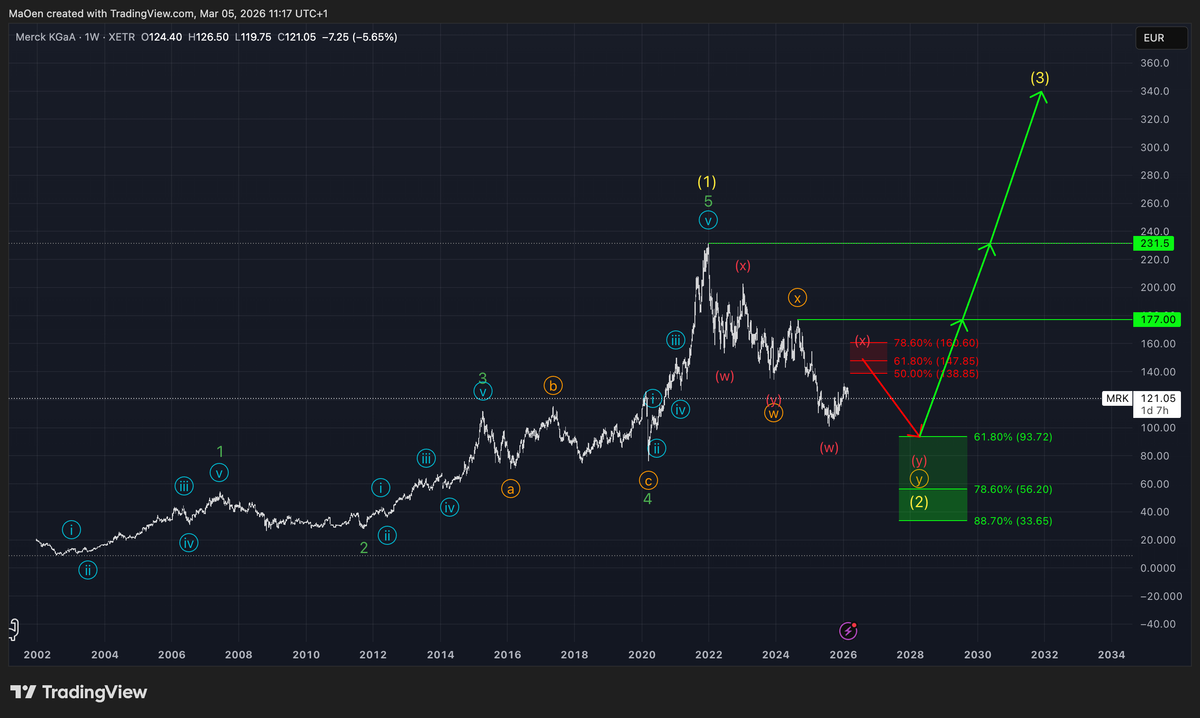
Since 2002, Merck has shown a structurally clean price action. The formation of green wave 1 and the corrective green wave 2 in 2011 built the foundation for a long-term bull run.
After the completion of green wave 2, the stock gained strong bullish momentum and began to follow the green cycle, developing green wave 3 and the corrective green wave 4.
Since then, Merck has displayed an extremely bullish impulse in green wave 5, marking the completion of the green cycle and the end of the long-term bull market phase for this degree.
With the completion of green wave 5, Merck formed yellow wave 1 of a higher degree, reaching the current all-time high at $231.5.
Since then, the stock has entered a corrective phase, which is expected to unfold as yellow wave 2. We anticipate that this correction will develop in three waves: orange wave W, X, and Y.
Merck has already completed orange wave W and orange wave X and is currently trading within orange wave Y, the final leg of the overall correction.
Once this correction within yellow wave 2 is completed, we expect the stock to regain sustainable bullish momentum and begin new impulsive moves toward new all-time highs, initiating the early stages of a long-term yellow wave 3.
However, we have identified two Fibonacci zones where we expect the market to first experience a temporary rise, followed by a final major sell-off, which should complete the entire corrective structure.
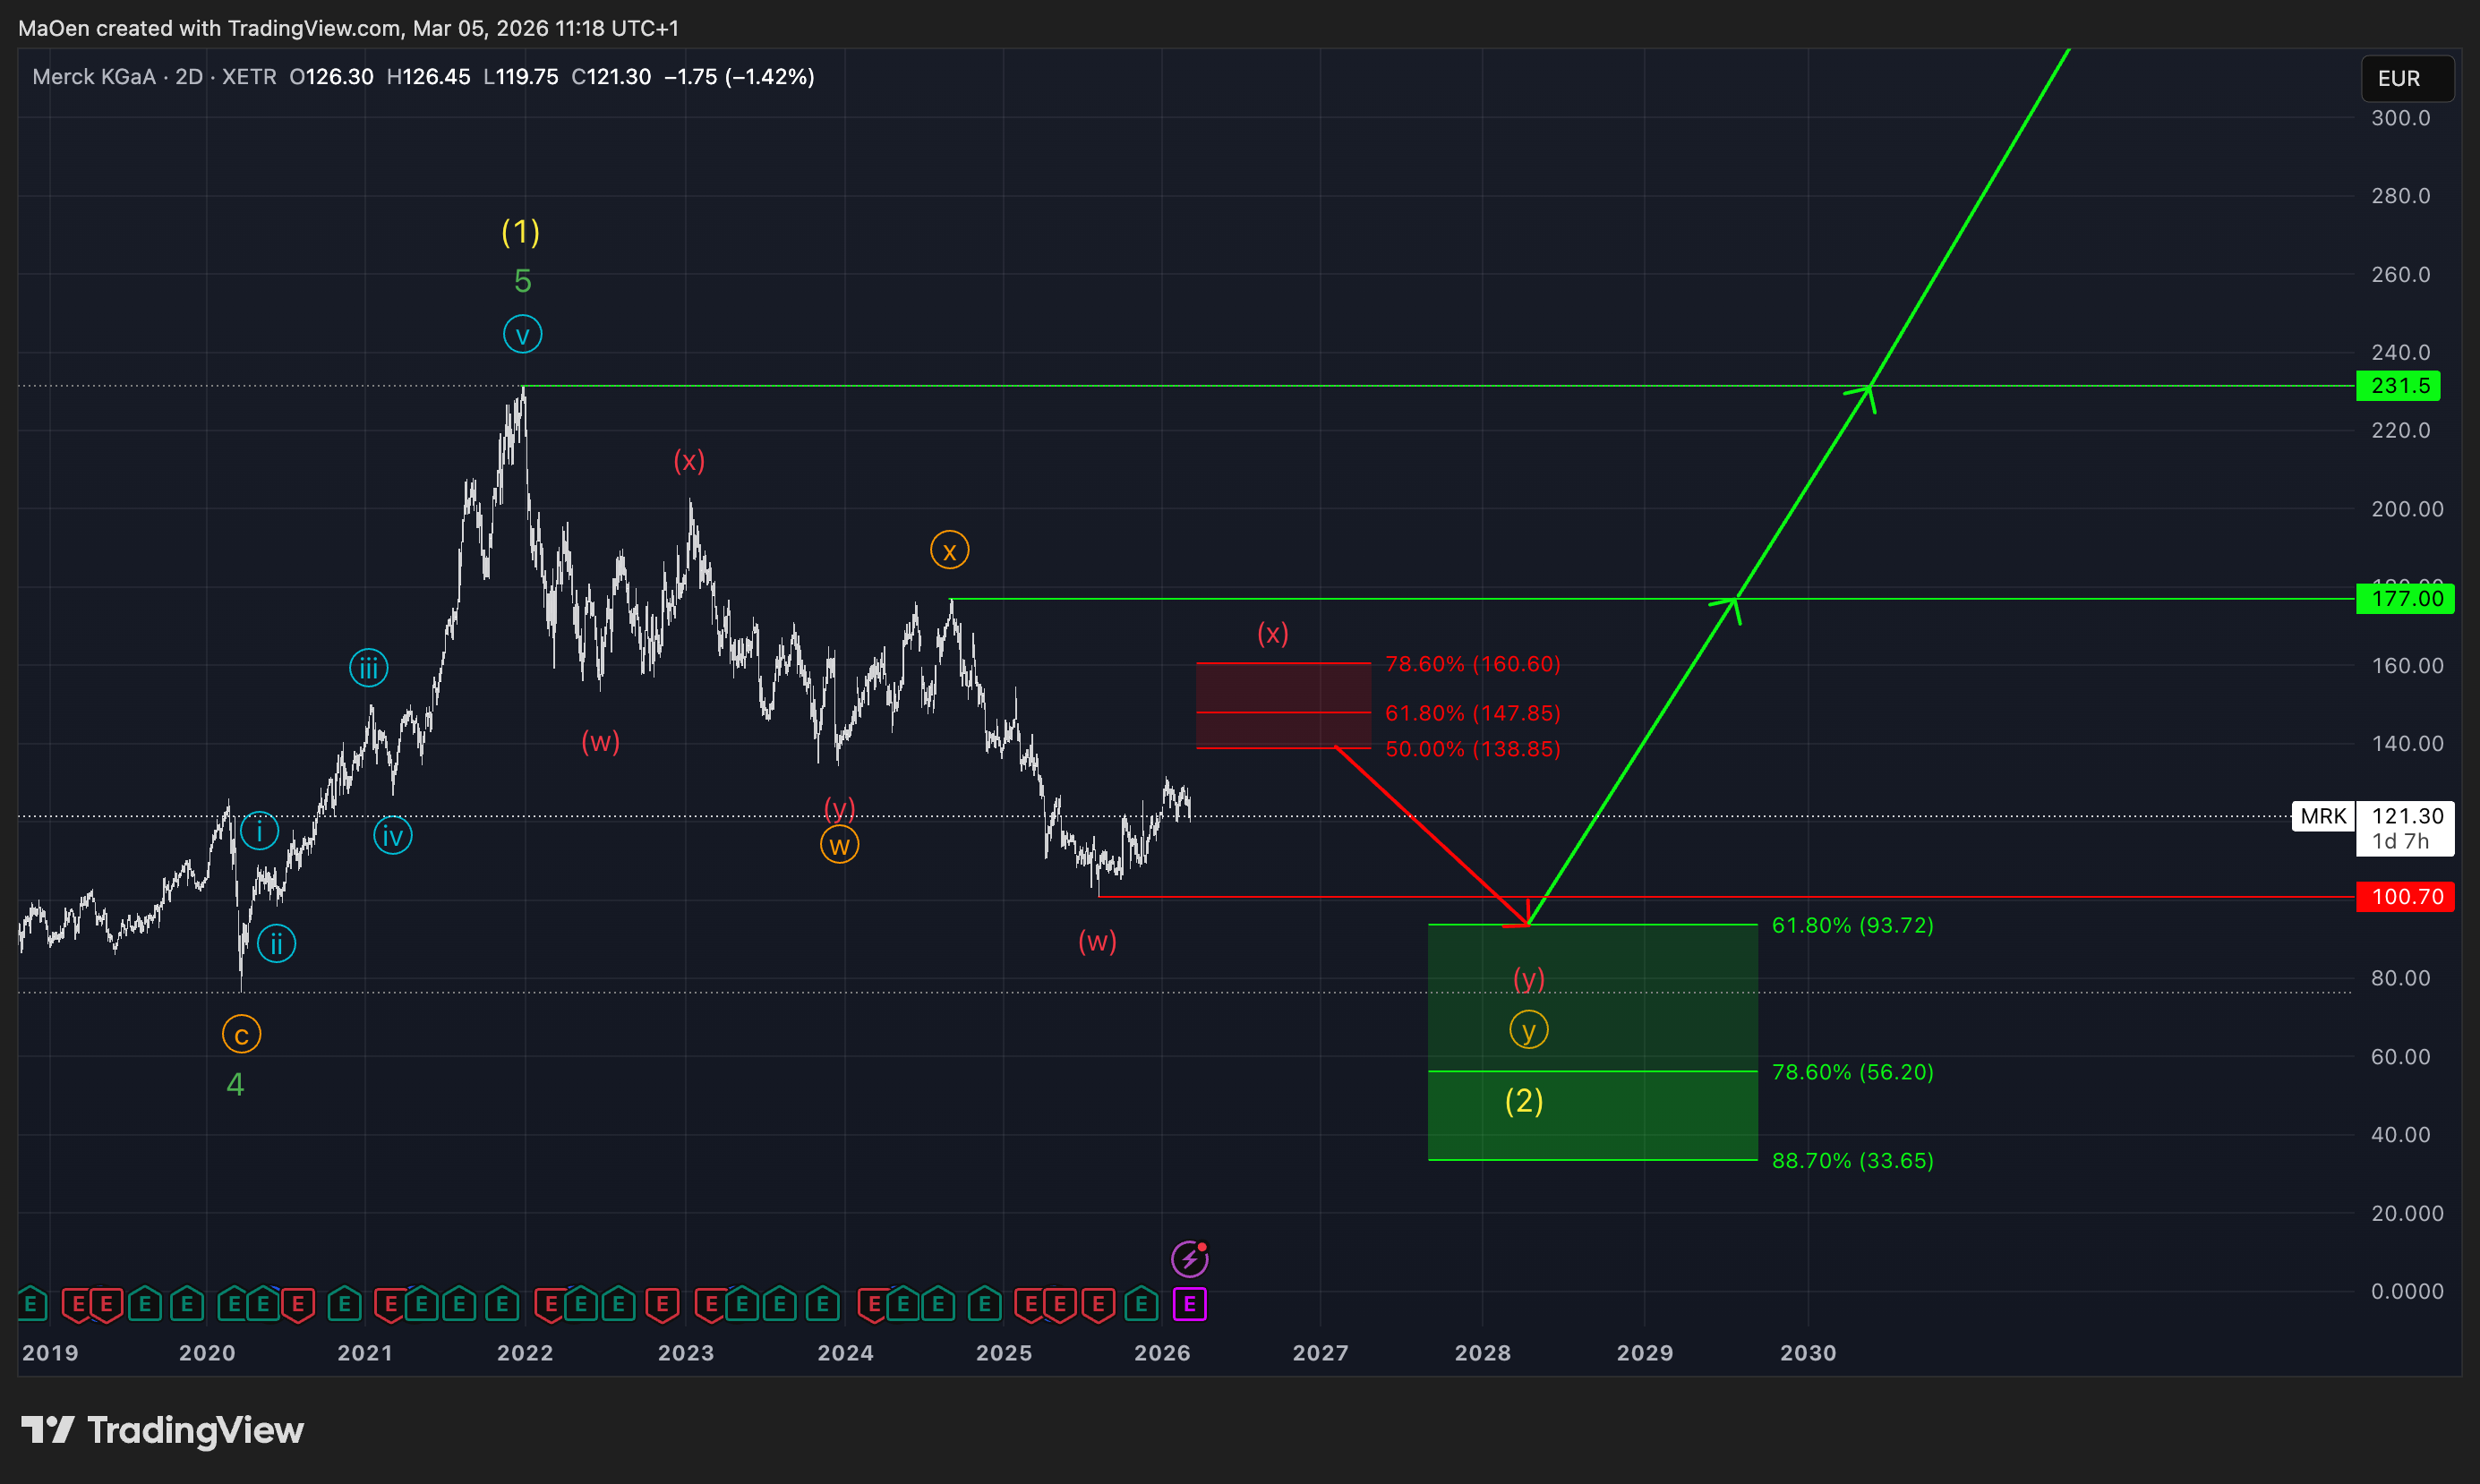
After the completion of orange wave X, the market declined again and formed red wave w of a lower degree.
Following the completion of red wave w, we expect the stock to rise into red wave x. For this red wave x, we have defined a Fibonacci selling zone, which ranges between:
- 50% at $138.35
- 61.8% at $147.85
- 78.6% at $160.60
We anticipate the market to rise into this selling zone, lose its current corrective bullish momentum, and initiate a major sell-off.
This sell-off is expected to form red wave y, which will complete the red cycle and unfold as orange wave Y. The completion of orange wave Y will end the entire correction and finalize yellow wave 2.
We expect the correction to extend to new lows below $100.70 and reach our anticipated Fibonacci retracement zone, defined by:
- 61.8% at $93.72
- 78.6% at $56.20
- 88.7% at $33.65
This area represents a potential buying or accumulation opportunity, as we expect bullish momentum to re-enter the market within this zone, allowing Merck to initiate new impulsive movements and begin the next long-term bull phase in yellow wave 3.
If any structural changes occur or one of our Fibonacci zones is activated, we will update you immediately.
Kind regards,
Monalytics
DISCLAIMER: The content on this website, including charts, analyses, and recommendations, is for informational purposes only and does not constitute financial, investment, or professional advice. Trading and investing involve risk. You should consult a qualified financial advisor before making any investment decisions.