Moderna (MRNA) EW-Analysis
This stock is forming a major bull market.
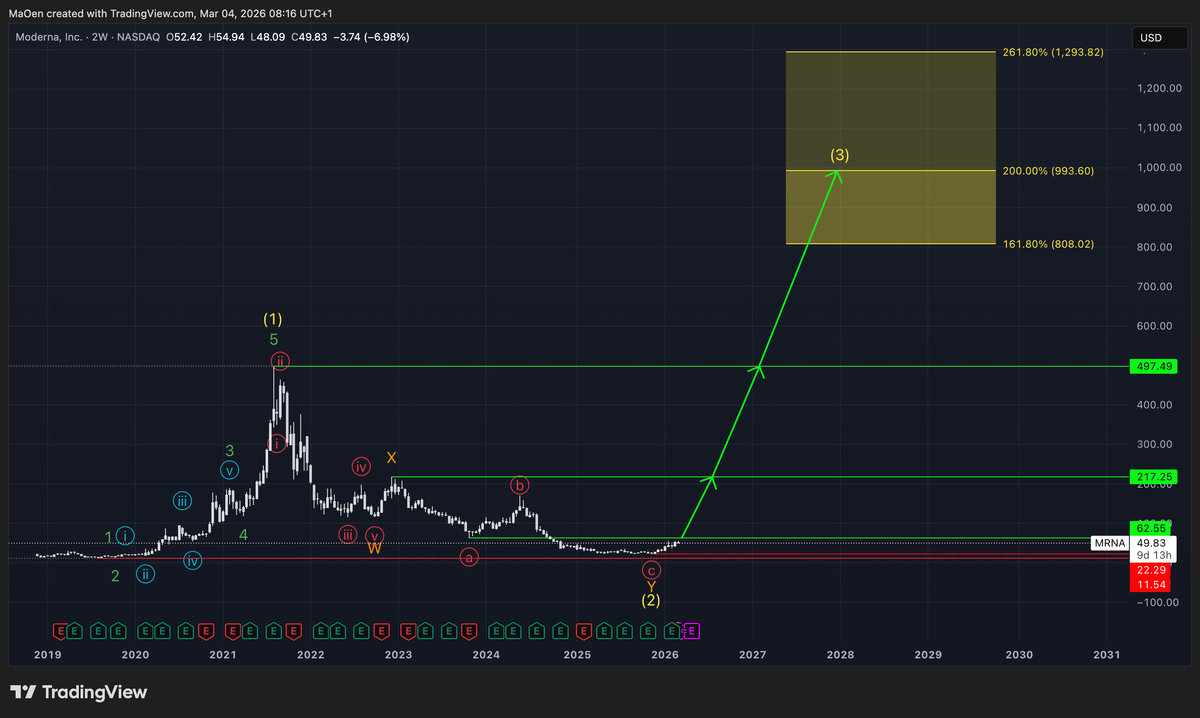
The Moderna stock is a very interesting asset. Since its IPO in December 2018, Moderna started a massive impulsive rally. The first bullish impulses formed the green cycle. With the completion of this green cycle at the all-time high of $497.49, Moderna completed yellow wave 1 of a higher degree, marking a major top.
After the completion of yellow wave 1, the stock initiated a large correction into yellow wave 2. This long-term correction pushed the market down by 95.50%, eventually finding its bottom at $22.29 in late 2025.
We expect that this correction has already bottomed out and that yellow wave 2 has been completed.
From this point onward, we expect strong and sustainable bullish momentum to return, forming a new long-term uptrend for the stock. In our long-term outlook, we anticipate that this market will reach new all-time highs over the next few years and is currently in the early stages of developing a bullish long-term yellow wave 3.
For this wave 3, we have defined a Fibonacci price target zone where we expect this wave to potentially complete.
This target zone ranges from:
- 161.8% at $808.02
- 200% at $993.60
- 261.8% at $1,293.82
This zone represents our long-term price targets for the upcoming bull market in this stock.
In addition to our long-term outlook, we have also defined a Fibonacci retracement zone, which may provide potential buying opportunities in line with our long-term bullish outlook for Moderna.
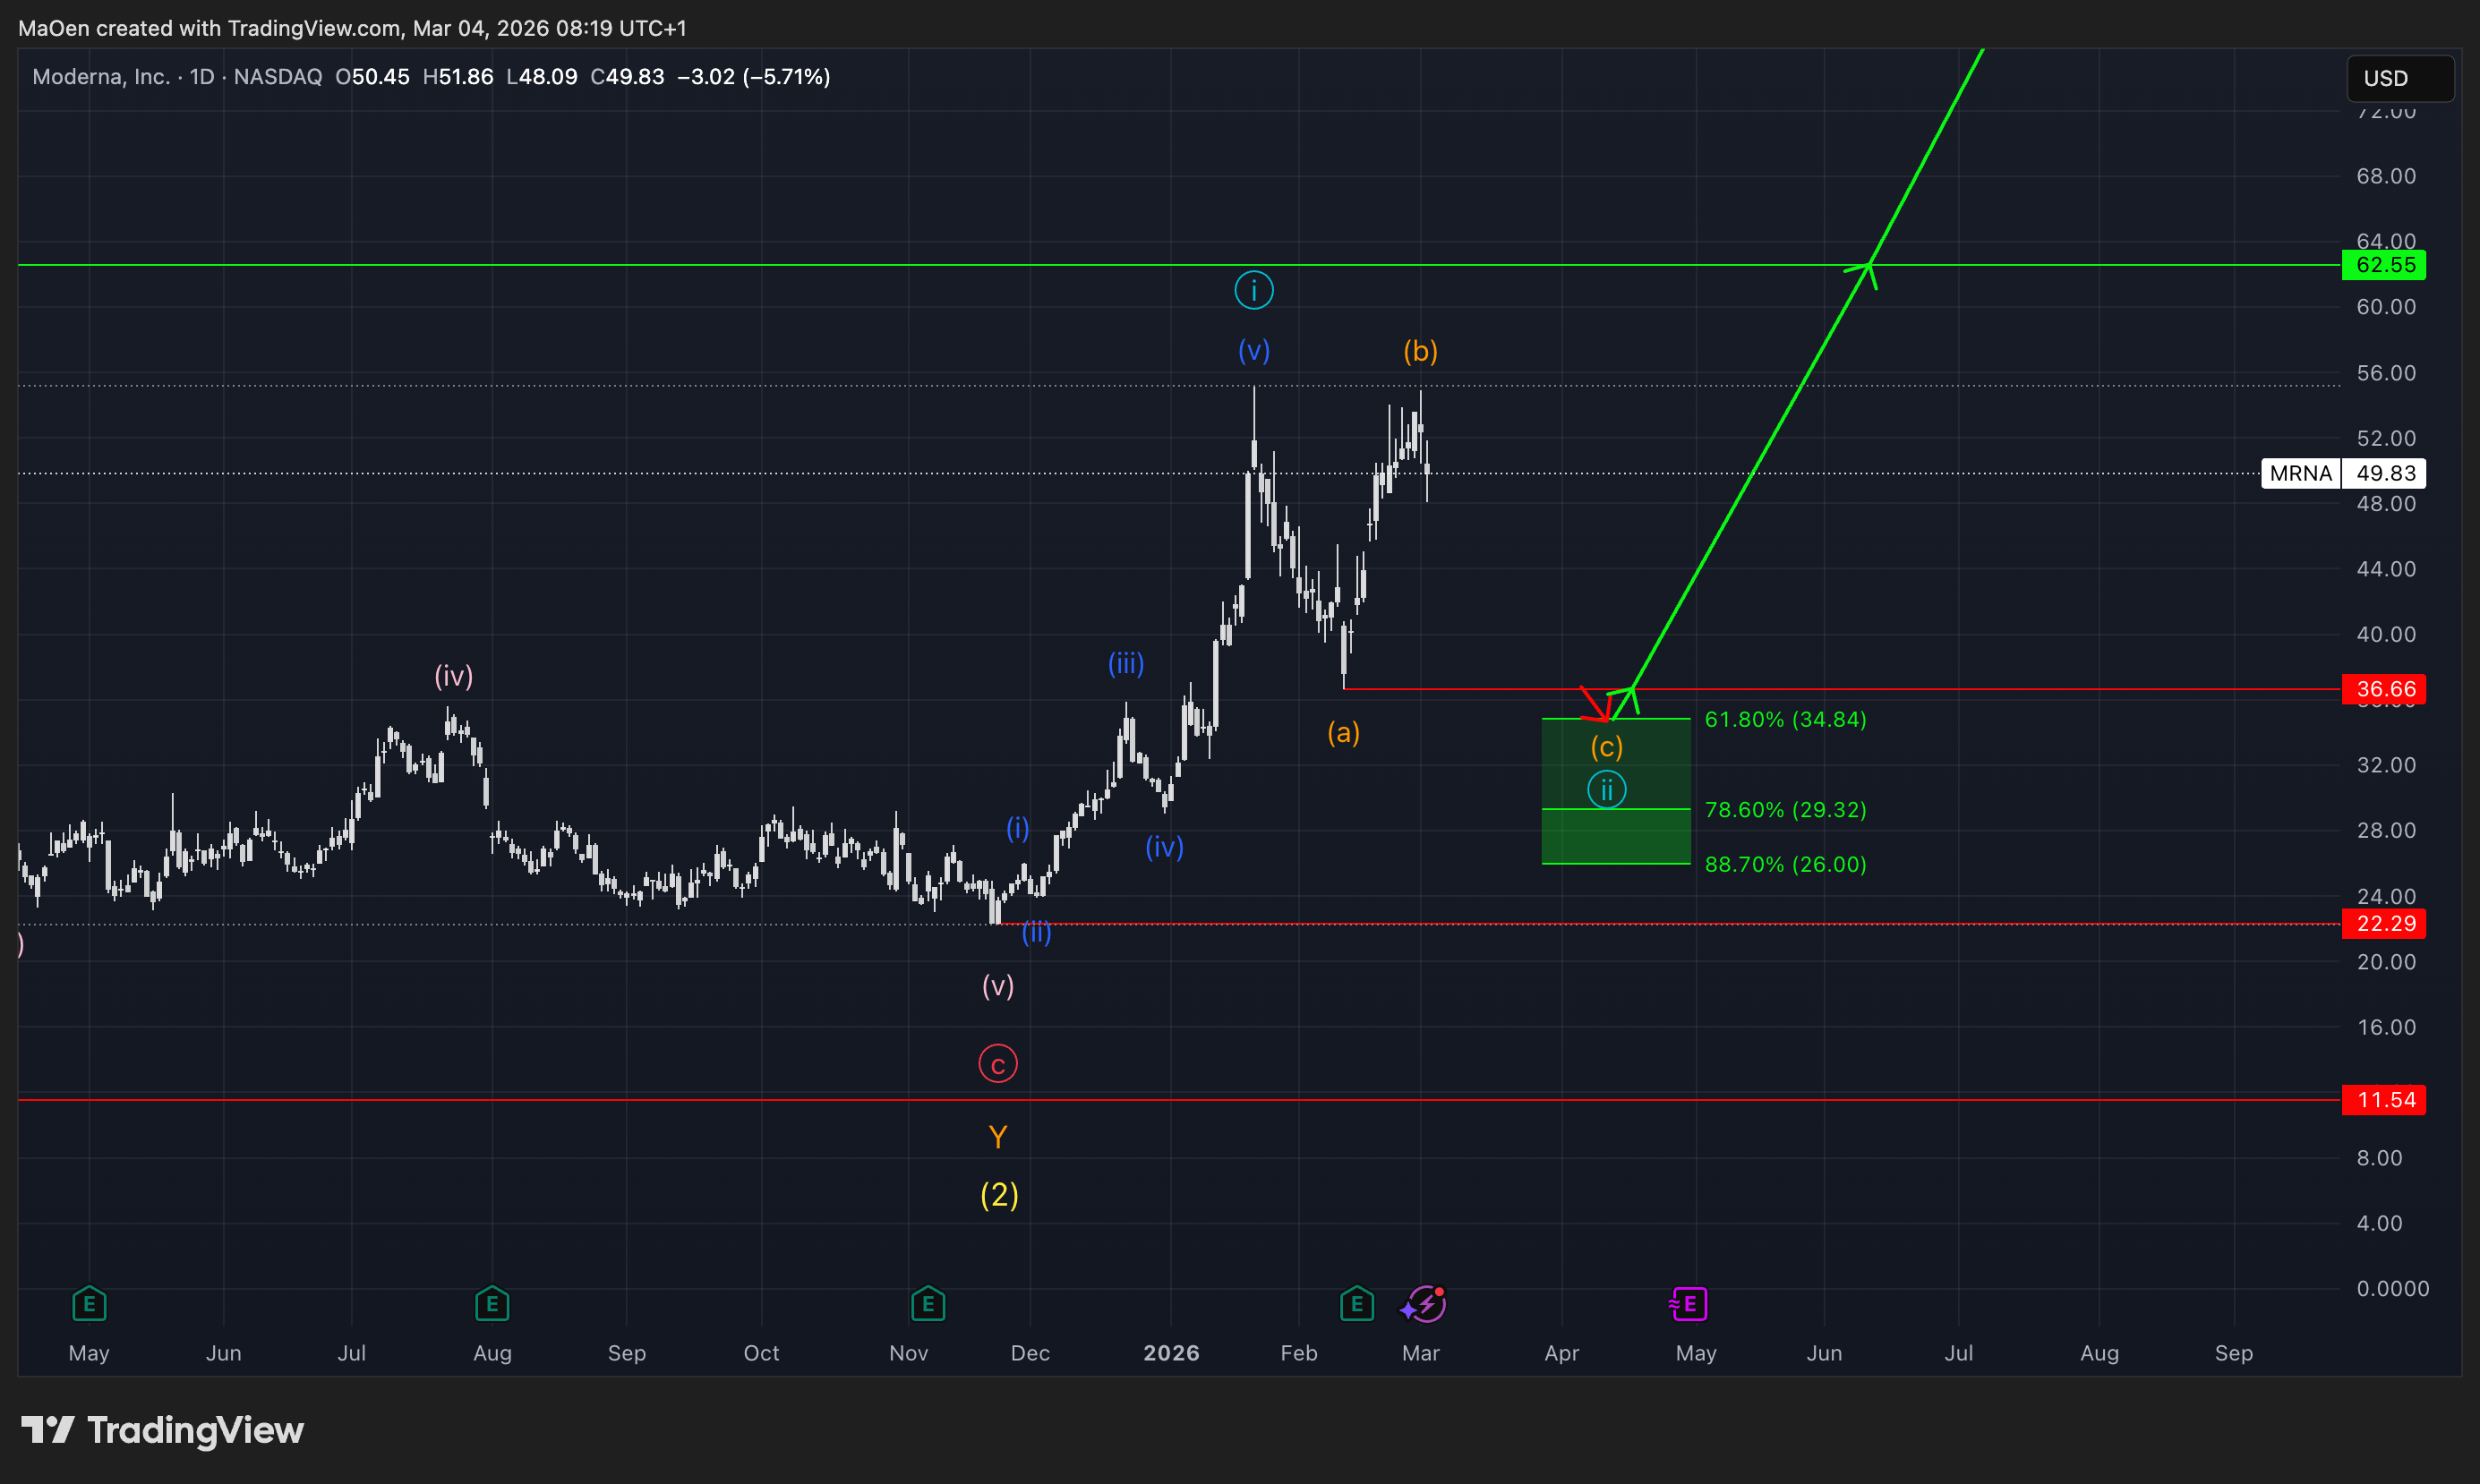
Since the completion of yellow wave 2, and therefore the completion of the entire correction, Moderna has regained bullish momentum and has begun forming a new strong impulse.
By creating light blue wave 1, the stock is now entering a short-term correction into light blue wave 2. From there, we anticipate a continuation of our long-term scenario, with the market building the light blue cycle and eventually moving back toward the all-time high.
For this current light blue correction, we have defined a Fibonacci retracement zone where we expect this short-term correction to potentially come to an end and form new bullish impulses.
This Fibonacci retracement zone is defined by the following levels:
- 61.8% at $34.84
- 78.6% at $29.32
- 88.7% at $26.00
From our point of view, this zone represents prime buying opportunities at extremely attractive price levels for a currently undervalued stock.
This is only one Fibonacci retracement zone among several more that we will share throughout the upcoming bull market for Moderna. However, this current zone is expected to offer the cheapest prices and, by far, one of the greatest opportunities to buy or accumulate this stock.
If any structural changes occur, or if Moderna activates our Fibonacci retracement zone, we will update you immediately.
Kind regards,
Monalytics
DISCLAIMER: The content on this website, including charts, analyses, and recommendations, is for informational purposes only and does not constitute financial, investment, or professional advice. Trading and investing involve risk. You should consult a qualified financial advisor before making any investment decisions.