Morgan Stanley (MS) EW-Analysis
Morgan Stanley Approaching a Major Correction.
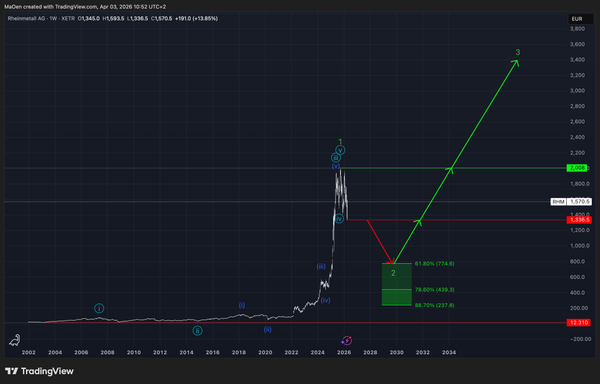
In 1993, Morgan Stanley began its first bullish impulsive movement within the green cycle. This impulsive fractal ended around early 2000, unfolding into yellow wave 1 and forming a major high for this market.
After an additional correction into yellow wave 2, the market completed a long-term bullish impulse and laid the foundation for an over-cyclical bull market in the long run.
Following the completion of yellow wave 2 at $11.58, Morgan Stanley regained strong bullish momentum within the light blue cycle and reached new all-time highs above the peak of yellow wave 1.
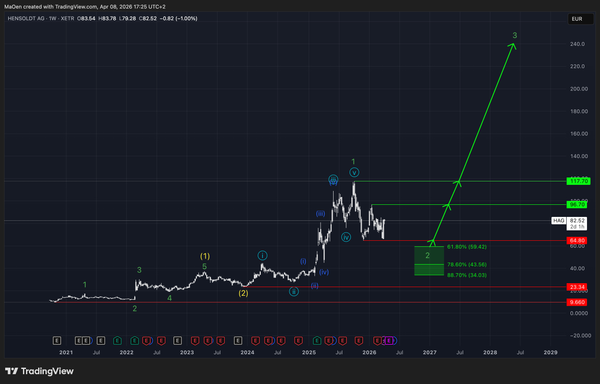
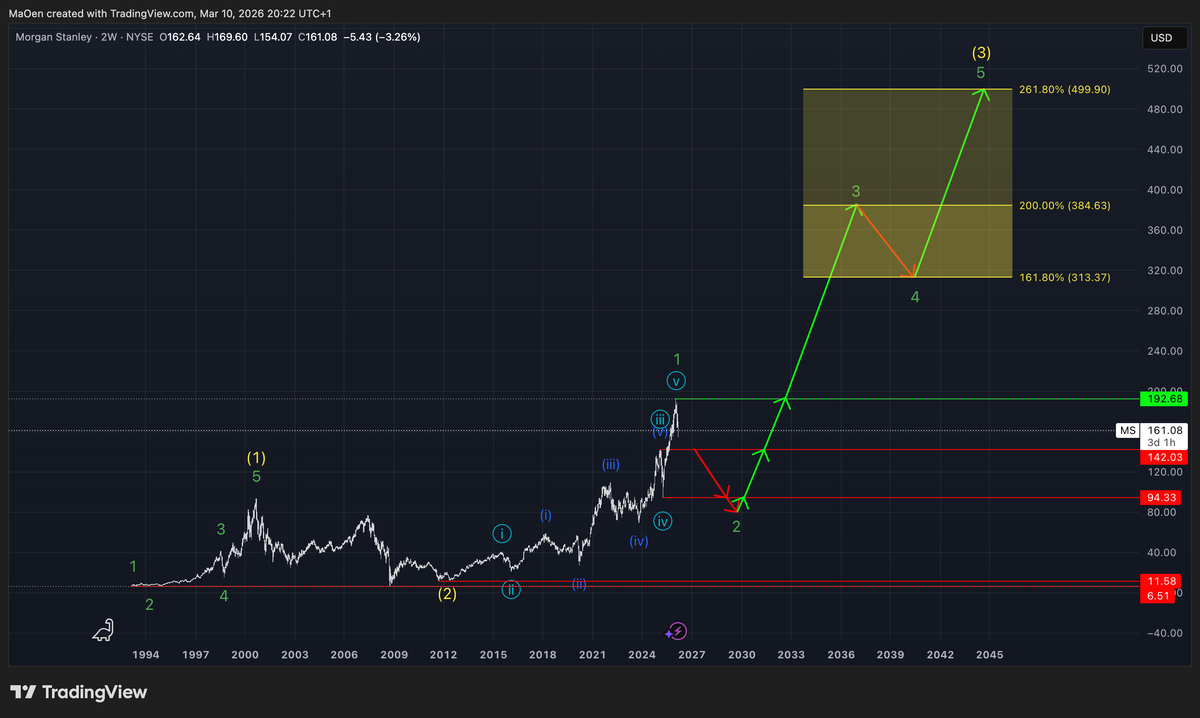
Currently, we expect that the light blue cycle has come to an end and has unfolded as green wave 1 at the all-time high at 192,68$. This green cycle represents a lower degree relative to the yellow cycle and should continue to develop within a strong long-term bull market, eventually expanding into yellow wave 3.
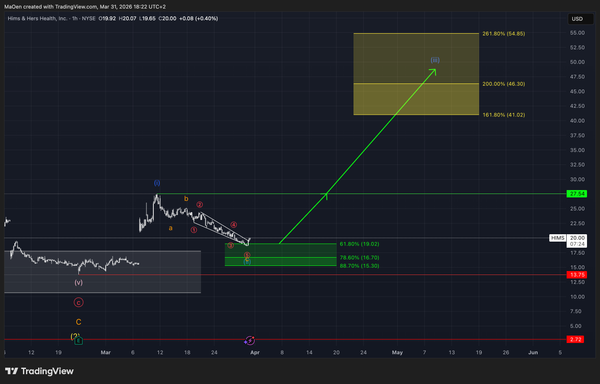
We have defined a Fibonacci price target zone, which represents the levels this stock could potentially reach if the green cycle unfolds as expected. This zone should be viewed as a guideline indicating the possible expansion range of the market.
The target levels are:
- 161.8% – $313.37
- 200% – $384.63
- 261.8% – $499.90
At the moment, we expect that green wave 1 has already been completed, and the market is now entering a corrective phase into green wave 2.
Once this correction is finished, we expect green wave 3 to expand rapidly toward new all-time highs and into our defined price target zone. After that, the market should enter a corrective phase within green wave 4, before approaching a final bullish move in green wave 5.
This final impulse would ultimately contribute to the development of yellow wave 3 on the higher long-term degree.
In the short to mid-term, the completion of green wave 1 suggests that the market is currently undergoing a corrective phase forming green wave 2. Once this correction is complete, the market should resume the next bullish impulse and continue its long-term expansion within the green cycle, progressing toward yellow wave 3.
For the correction of green wave 2, we have defined a Fibonacci retracement zone, where we expect this entire corrective phase to eventually come to an end.
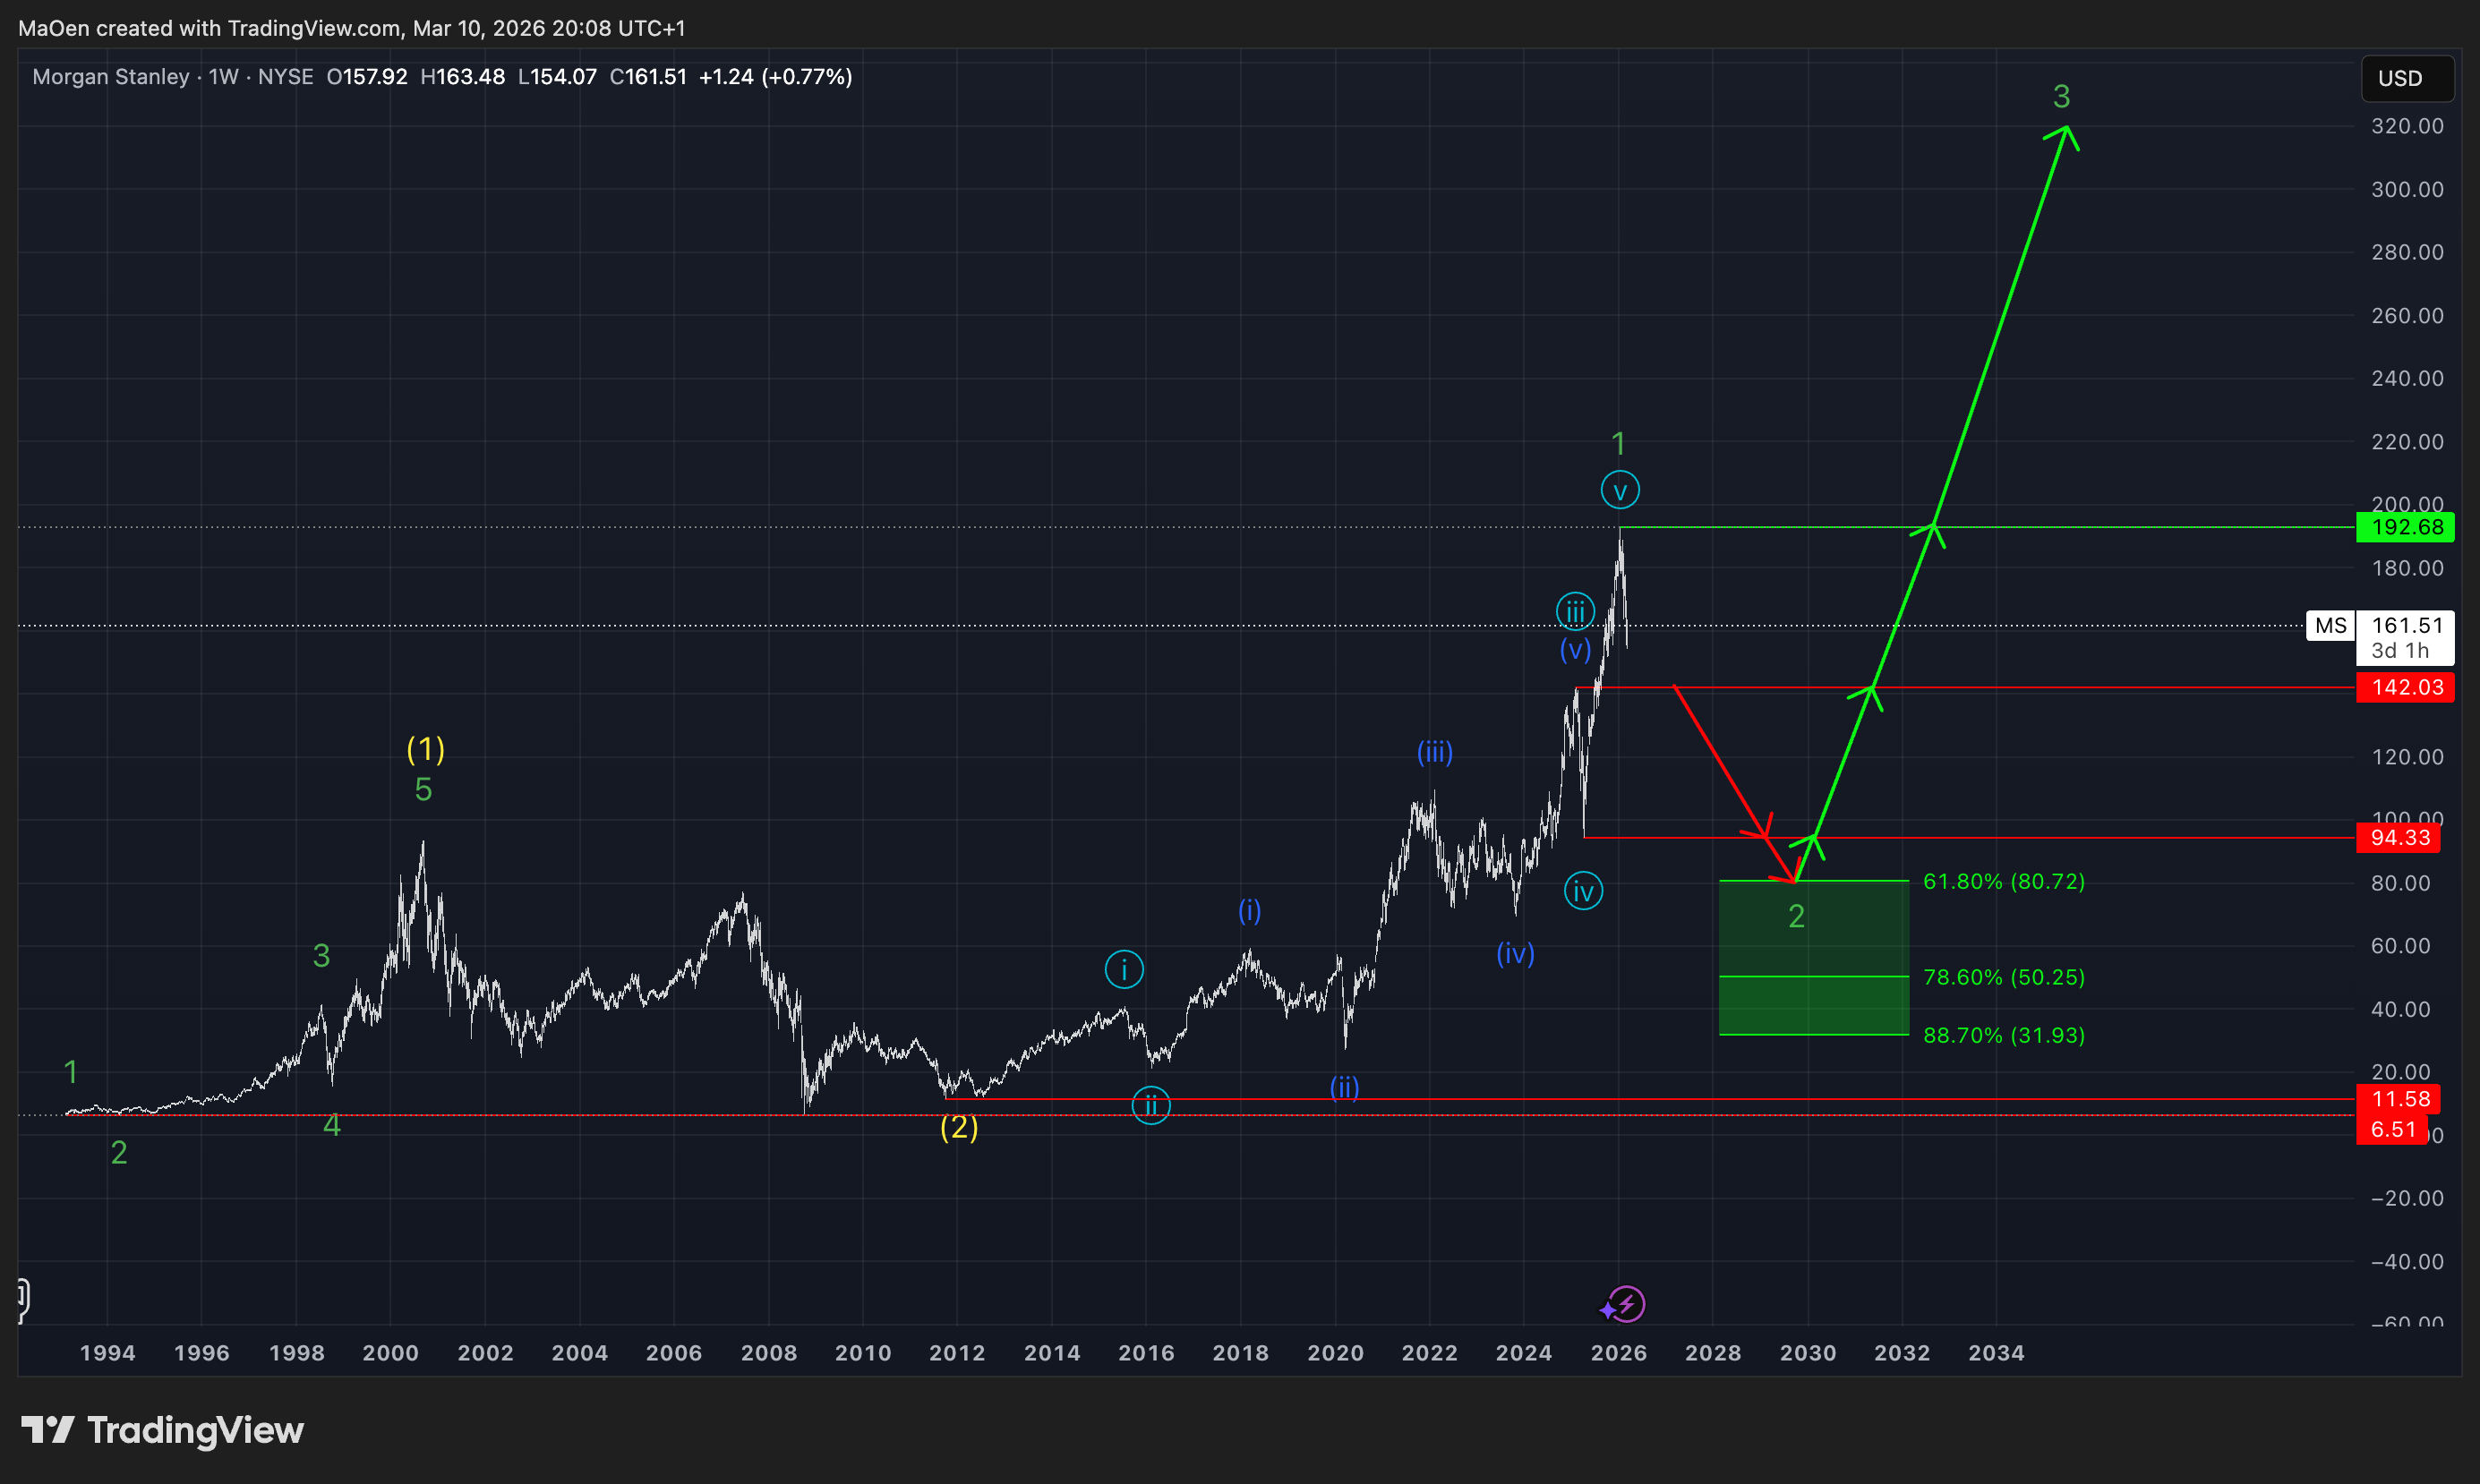
This Fibonacci retracement zone for green wave 2 ranges from:
- 61.8% at $80.72
- 78.6% at $50.25
- 88.7% at $31.93
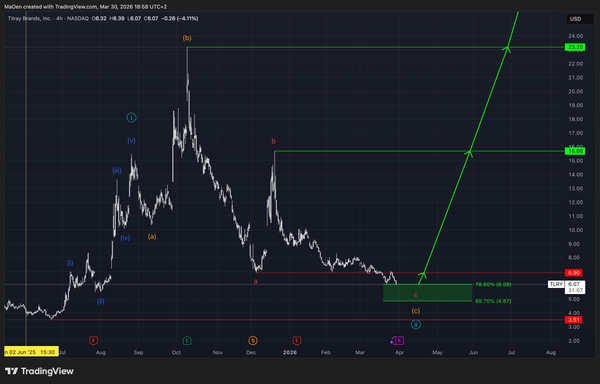
Within this zone, the current correction is expected to come to an end and the market should regain strong bullish momentum, initiating new impulsive movements into green wave 3 and continuing our long-term expectation.
According to our analysis, this zone represents prime buying and accumulation levels for this stock and opens significant opportunities to acquire shares at extremely attractive prices.
If any structural changes occur or if our Fibonacci retracement zone becomes activated, we will update you immediately.
Kind regards,
Monalytics
DISCLAIMER: The content on this website, including charts, analyses, and recommendations, is for informational purposes only and does not constitute financial, investment, or professional advice. Trading and investing involve risk. You should consult a qualified financial advisor before making any investment decisions.