Nvidia EW-Analysis
This chart represents Nvidia in its Mid-short term Elliot wave analysis, with our primary expectations for this market.
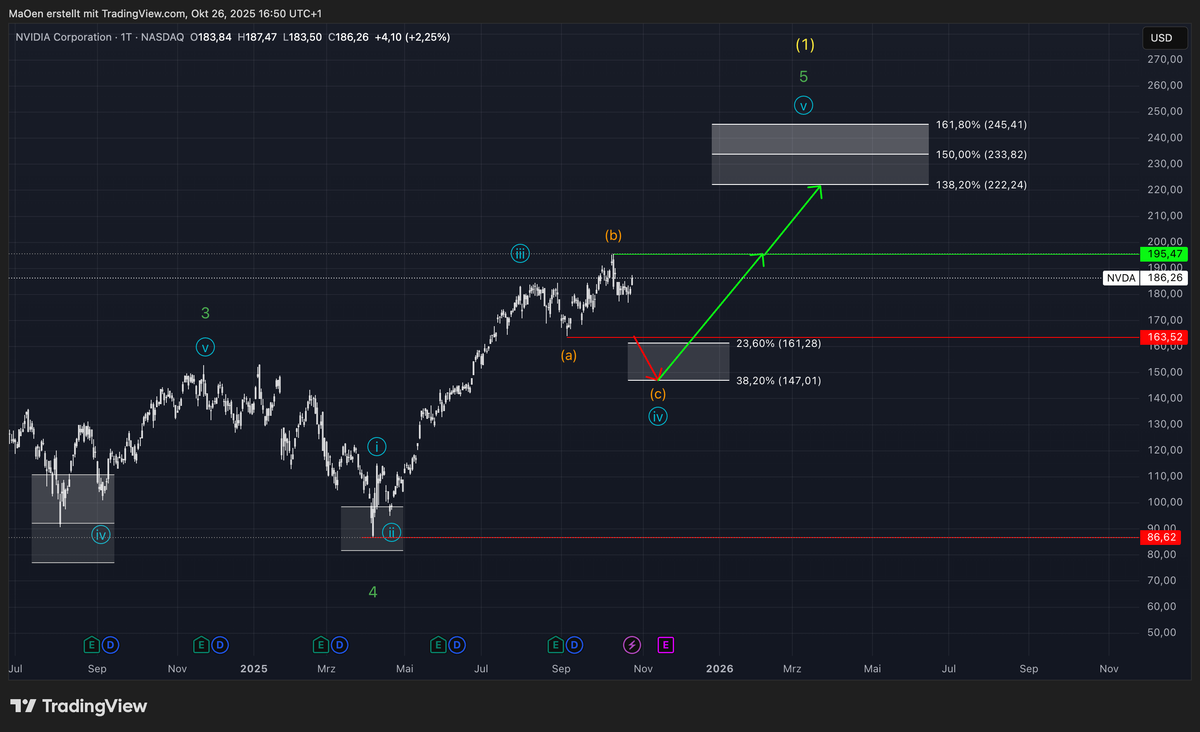
NVIDIA appears to be approaching the final stages of its yellow Wave 1, completing its first major long-term impulsive advance. Once this larger impulse is finalized, the stock is expected to transition into a corrective yellow Wave 2, which should unfold as a more prolonged consolidation phase before the broader bullish trend resumes.
Before reaching this long-term top, however, the short-term structure suggests that NVIDIA may still offer one final buying opportunity before topping out and beginning the next corrective cycle. The light-blue wave sequence has already completed an impulsive Wave 1, followed by a corrective Wave 2, and an extended Wave 3 — the strongest phase of the sequence. At present, the stock is correcting within light-blue Wave 4, which is expected to act as the final pullback before the market regains upward momentum and pushes into light-blue Wave 5, thereby completing both green Wave 5 and yellow Wave 1.
For this short-term correction in light-blue Wave 4, we have defined a Fibonacci retracement target zone between the 23.6% and 38.2% retracement levels, ranging from 161.28 USD down to 147.01 USD. This area represents a technically significant region where the correction could potentially end, allowing the market to reestablish bullish momentum and move into its final impulsive advance.
If NVIDIA successfully completes its Wave 4 within this target zone and subsequently breaks above its all-time high at 195.47 USD, it would confirm the continuation of the impulse toward our Fibonacci expansion target zone. This projected target range extends from the 138.2% expansion level at 222.24 USD to the 161.8% expansion level at 245.41 USD. Within this region, we expect the final phase of the long-term yellow Wave 1 to complete, marking the potential formation of a major top before the next larger corrective movement begins.
Trading Plan:
We recommend waiting for one of two signals before taking action. Either wait for NVIDIA to enter the Fibonacci retracement zone between 161.28 USD and 147.01 USD, which could present a final short-term buying opportunity, or wait for a confirmed breakout above the all-time high at 195.47 USD to validate the start of the final impulsive rally. Once price reaches the 222–245 USD region, we expect the stock to complete yellow Wave 1 and begin its transition into the corrective yellow Wave 2, in line with our broader long-term expectations.
Keep in mind:
This outlook reflects our primary expectation for Nvidia`s Mid to short-term performance. Always ensure that you review our long-term projections first before moving on to our mid- and short-term Elliott Wave analyses.
(The content on this website, including charts, analyses, and recommendations, is for informational purposes only and does not constitute financial, investment, or professional advice. Trading and investing involve risk. You should consult a qualified financial advisor before making any investment decisions!)