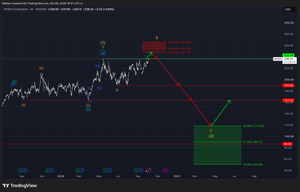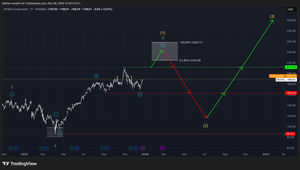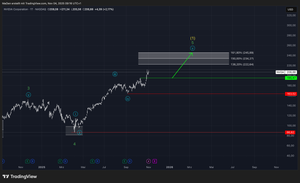
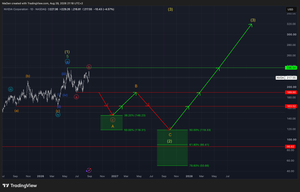
We expect NVIDIA to have already established a major long-term high at its all-time high of $236.54, which we identify as Yellow Wave 1.
From this high, we expect NVIDIA to enter a long-term corrective phase. As we anticipate this correction to develop in a standard A-B-C structure, we have identified two Fibonacci retracement zones.
The first zone represents our expected target for the completion of Orange Wave A, the first leg of the correction. Within this zone, we expect NVIDIA to find short-term bullish momentum and begin a recovery phase in the form of Orange Wave B.
Short-Term Long Entry Levels
- 38.2%: $146.23
- 50%: $118.33
If NVIDIA reaches this zone, we would view it as a short-term trading opportunity, as we expect a bullish recovery into Orange Wave B.
However, we do not consider this area to be a long-term buying opportunity. Our primary scenario expects NVIDIA to continue its broader correction after the Orange Wave B recovery and eventually complete the long-term corrective structure within our second Fibonacci retracement zone.
This second zone represents our expected area for the completion of Orange Wave C and Yellow Wave 3, potentially marking the major long-term bottom of the correction.
Long-Term Entry Levels
- 50%: $118.33
- 61.8%: $90.41
- 78.6%: $50.66
Should NVIDIA reach this second Fibonacci zone, we would consider it a major long-term buying opportunity, as we expect the completion of the corrective phase to provide the foundation for the next major bullish cycle.
In summary, we are currently watching two key areas: the first Fibonacci zone for a potential short-term recovery trade and the second Fibonacci zone for a potential major long-term accumulation opportunity.
If anything significant happens with NVIDIA or our expected structure changes, we will update you immediately.
Kind regards,
Monalytics
DISCLAIMER: The content on this website, including charts, analyses, and recommendations, is for informational purposes only and does not constitute financial, investment, or professional advice. Trading and investing involve risk. You should consult a qualified financial advisor before making any investment decisions.