PayPal (PYPL) EW-Analysis
PayPal Builds a Generational Bottom
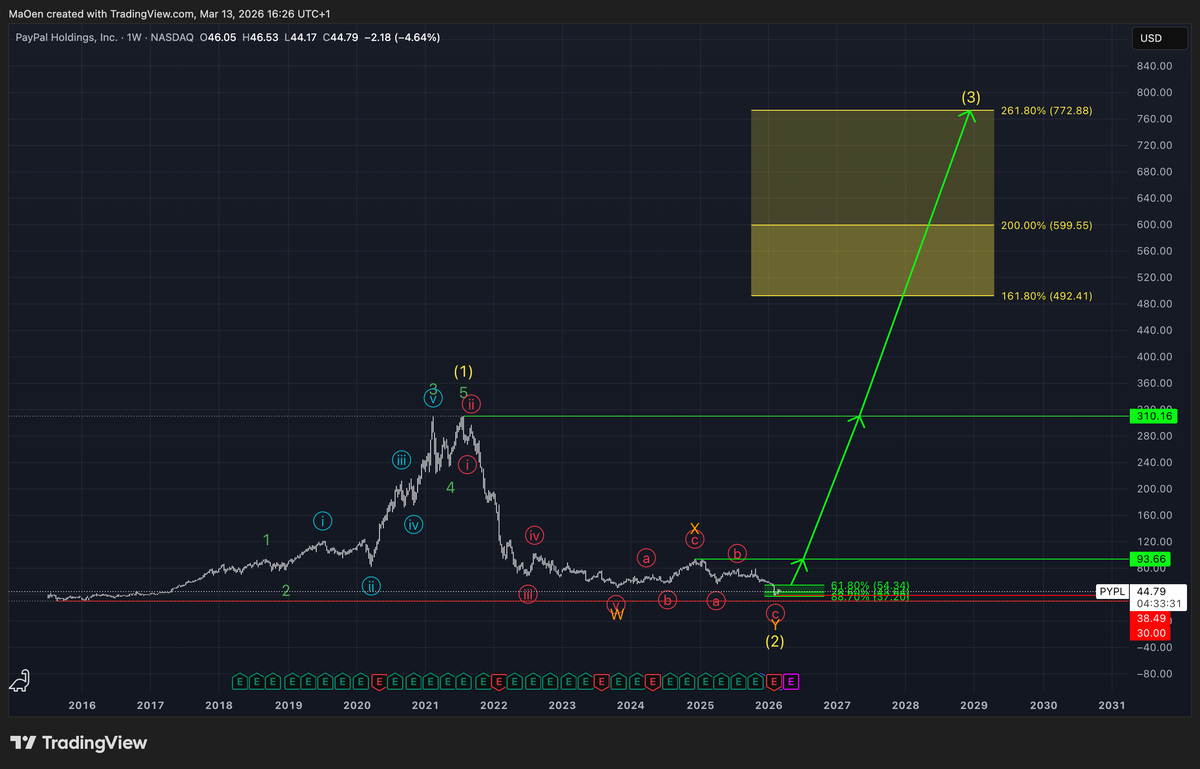
Since 2015, PayPal initiated its first bullish impulses and developed a major impulsive fractal, completing green wave 1 in 2018. This green cycle formed the foundation for a long-term uptrend in the stock.
After the completion of green wave 1, PayPal entered a corrective phase, forming green wave 2. Once this correction ended, the market expanded within the light-blue cycle, driving the development of green wave 3, the strongest phase of the trend.
Following this powerful advance, the market corrected within green wave 4, retracing part of the previous wave 3movement. After this correction was completed, the stock initiated the final bullish impulse of the cycle with green wave 5. This wave concluded the entire green cycle and simultaneously formed yellow wave 1 of a higher degree.
With the completion of yellow wave 1, the long-term uptrend that began in 2015 came to an end in 2021. From that point onward, the market entered a prolonged corrective phase, unfolding as yellow wave 2.
We currently expect that this correction has finally reached its conclusion, with yellow wave 2 terminating at a bottom price of $38.49.
From the completion of yellow wave 2, we anticipate the start of a new bullish phase. Over the long term, the stock is expected to initiate strong upward impulses, forming yellow wave 3 and expanding over the coming years toward new all-time highs. This yellow wave 3 is expected to reach our projected Fibonacci price zone. This zone ranges from:
- 161.8% at 492,41$
- 200% at 599,55$
- 261.8% at 772,88$
The first key level to validate this bullish scenario is the long-term resistance at $93.66. A sustained break above this level would confirm the larger bullish structure and support the expectation of a move toward new all-time highs.
At the moment, however, the stock has only recently marked its bottom and is currently trading within a Fibonacci retracement zone that we have defined.
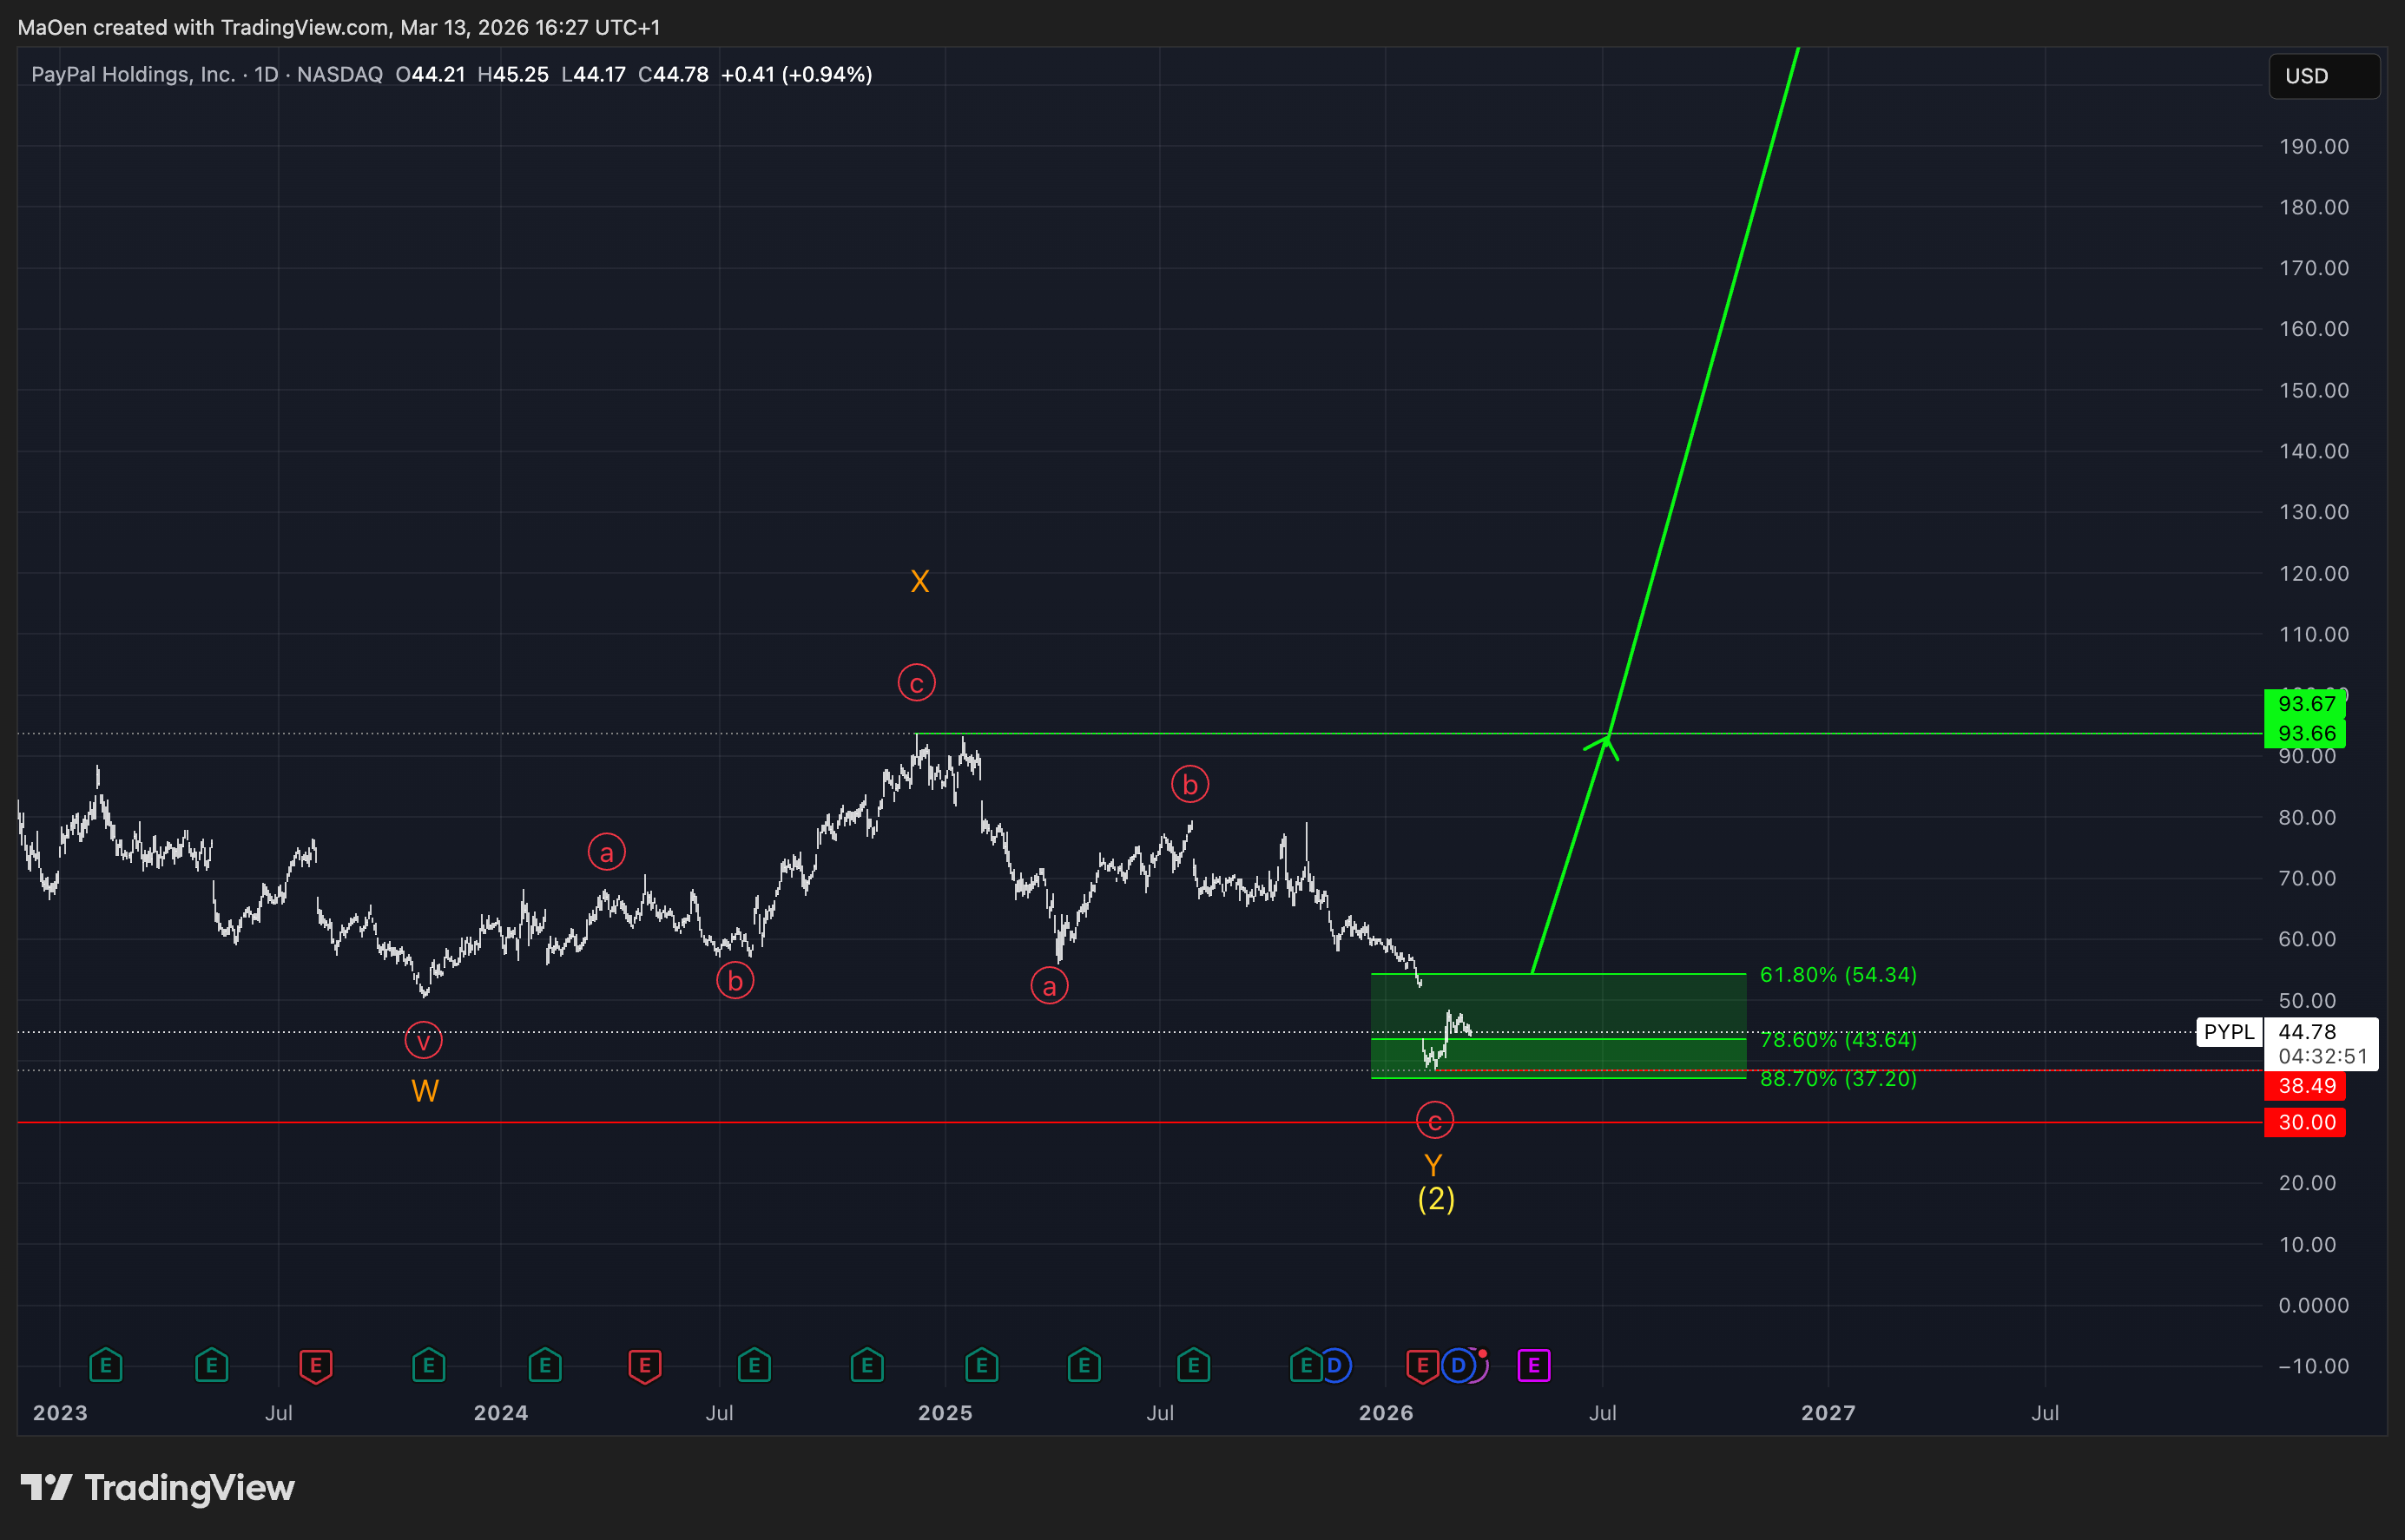
This Fibonacci retracement zone is defined between the following levels:
- 61.8% at $54.34
- 78.6% at $43.64
- 88.7% at $37.20
In early 2026, PayPal entered our defined Fibonacci retracement zone. Within this area, we expect the stock to form its long-term bottom and complete the entire corrective phase with the termination of yellow wave 2.
From our perspective, this zone represents a significant opportunity to buy or accumulate the stock at extremely attractive prices. Investors who use this zone for accumulation may potentially be buying near the absolute cyclical bottom, positioning themselves exceptionally well for a generational rally over the long term.
If the bottom forms as expected, the stock should begin to unfold into strong bullish impulses, initiating a new uptrend that aligns with our long-term outlook for the development of yellow wave 3 over the long-term.
Overall, the current setup presents a very favorable risk-to-reward profile.
Should any structural changes occur, or if PayPal leaves our Fibonacci retracement zone to the upside and thereby deactivates this zone, we will update you immediately.
Kind regards,
Monalytics
DISCLAIMER: The content on this website, including charts, analyses, and recommendations, is for informational purposes only and does not constitute financial, investment, or professional advice. Trading and investing involve risk. You should consult a qualified financial advisor before making any investment decisions.