Robinhood Markets (HOOD) EW-Analysis
Robinhood Markets in a Major Correction
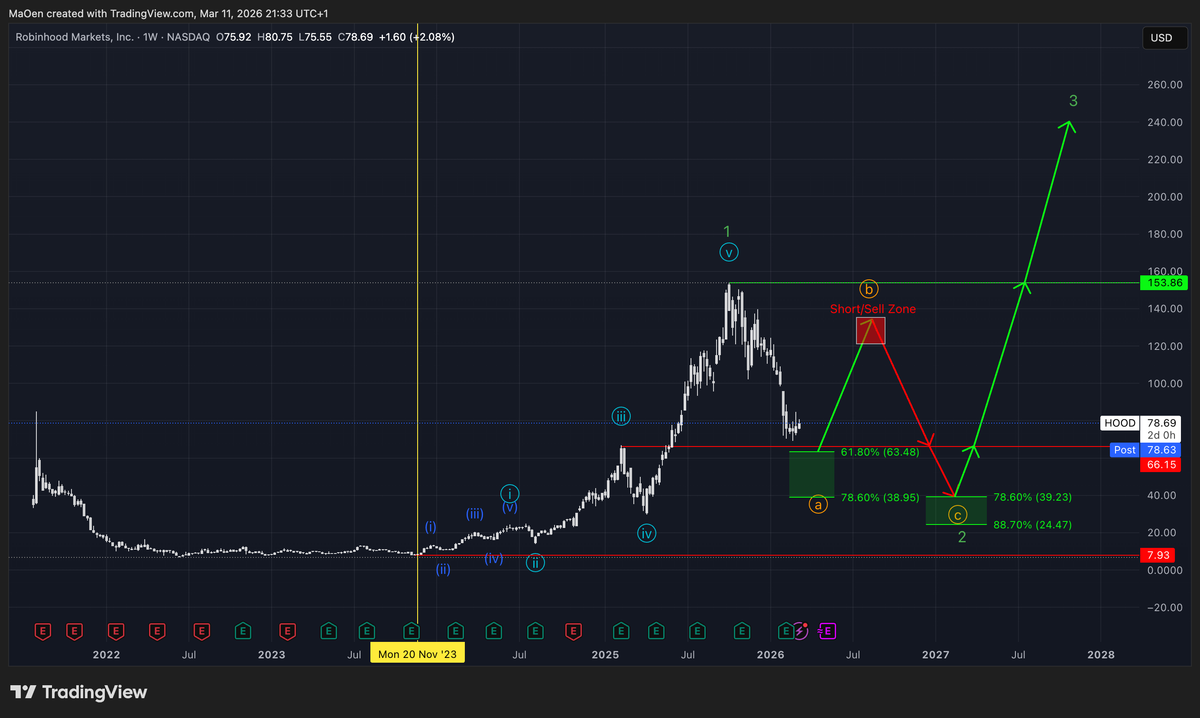
On Monday, 20 November 2023, Robinhood established a major bottom and began a long-term impulsive structure within the light-blue cycle. In late 2025, the stock completed this light-blue cycle and transitioned into green wave 1, creating a major cyclical bullish fractal for the overall market structure.
With the completion of green wave 1 at the current all-time high of $153.86, the stock has entered a corrective phase. This correction will most likely unfold as green wave 2, completing the first major long-term bullish impulse for this stock.
We expect this corrective phase to develop in a three-wave structure in order to complete the correction within green wave 2. First, we anticipate a sell-off — which is already underway — forming orange wave A. This should be followed by a short-term recovery phase within orange wave B. Finally, a larger sell-off in orange wave C is expected to occur, which would terminate the entire correction. After a completion we expect a strong expansion within green wave 3, reaching new all-time highs over the long run.
However for this corrective phase, we have identified two Fibonacci retracement zones that could represent potential buying or accumulation opportunities for the stock.
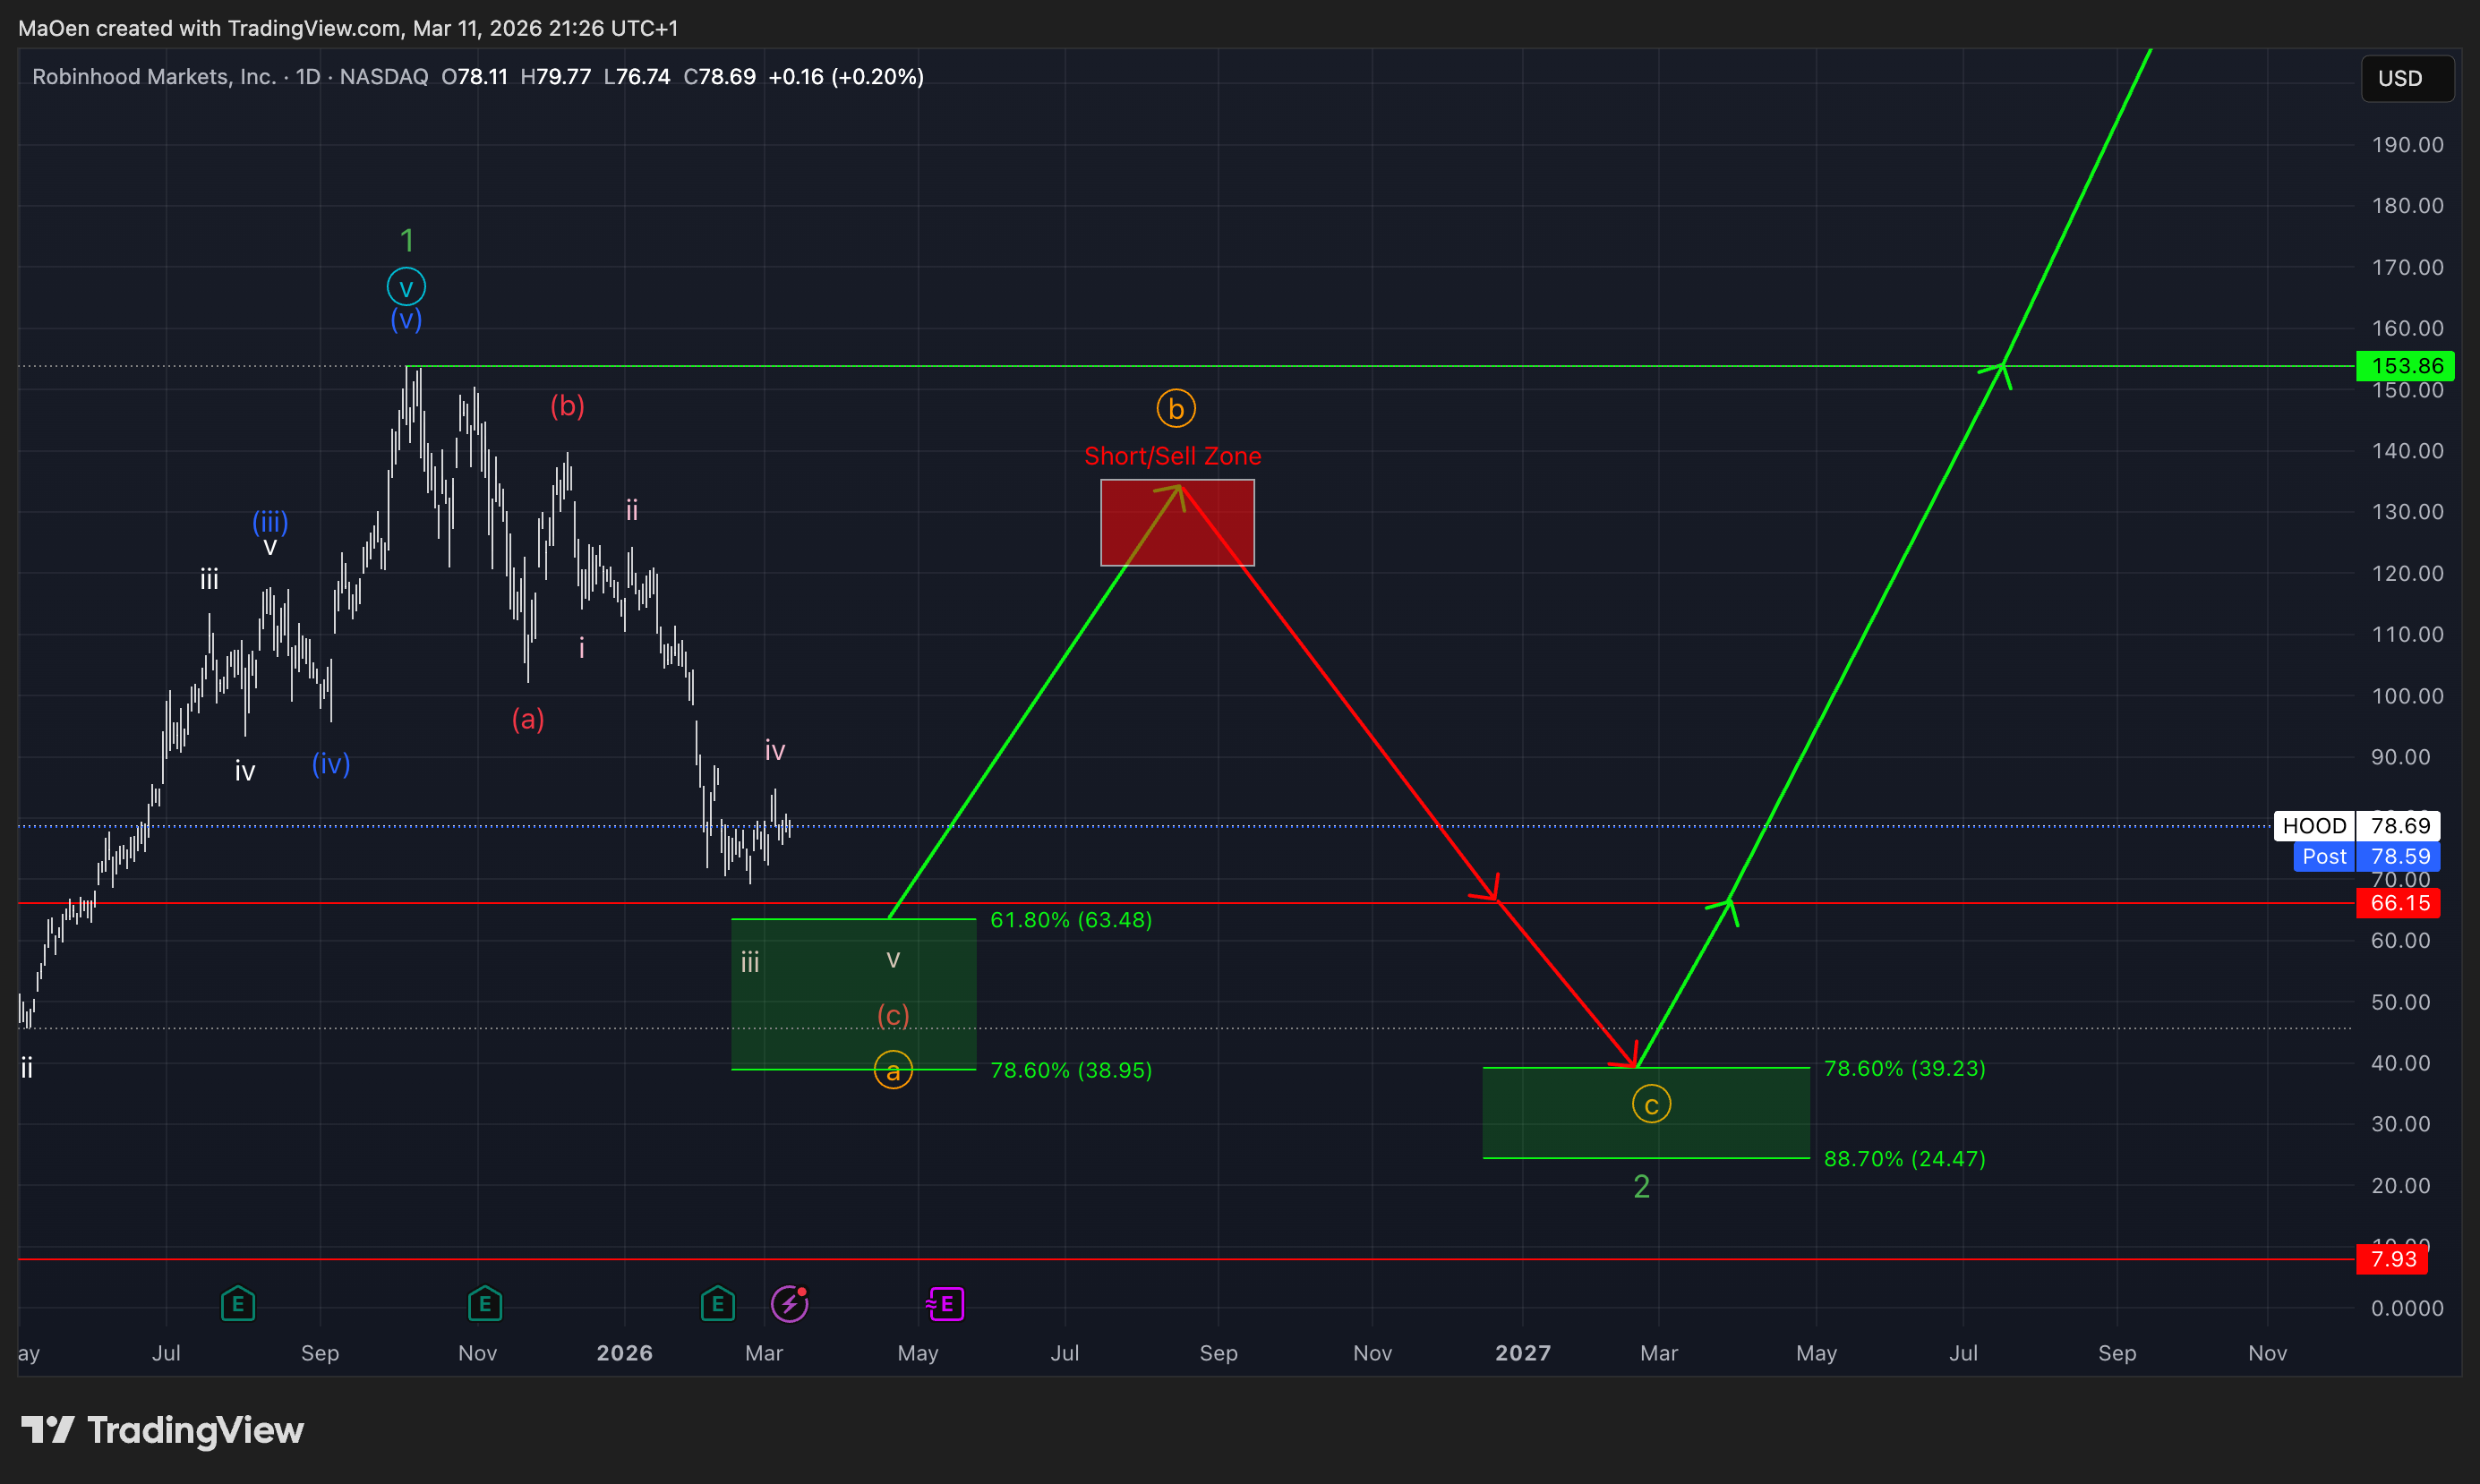
The first Fibonacci retracement zone ranges from:
- 61.8% at $63.48
- 78.6% at $38.95
This zone reflects a short- to mid-term buying opportunity, but also an area where existing positions can be managed through DCA (Dollar-Cost Averaging). Within this zone, we expect the market to complete the ongoing orange wave Aand subsequently recover with renewed short-term bullish momentum into orange wave B.
If this zone is successfully activated and validated, we will define a Fibonacci selling zone that could mark the end of orange wave B. This level can be interpreted as a selling or shorting opportunity, particularly for positions accumulated within our first Fibonacci retracement zone.
Our second Fibonacci retracement zone represents the potential end of the entire correction within orange wave C, completing green wave 2. This zone is defined at:
- 78.6% at $39.23
- 88.7% at $24.47
From our perspective, this zone represents prime long-term buying and accumulation levels for this stock at extremely attractive prices. As we expect the broader correction to terminate within this area, we anticipate that long-term bullish momentum will return, allowing the market to expand into green wave 3.
If any structural changes occur or if one of our Fibonacci zones becomes activated, we will provide an immediate update.
Kind regards,
Monalytics
DISCLAIMER: The content on this website, including charts, analyses, and recommendations, is for informational purposes only and does not constitute financial, investment, or professional advice. Trading and investing involve risk. You should consult a qualified financial advisor before making any investment decisions.