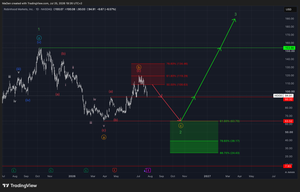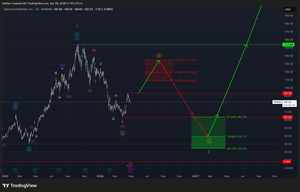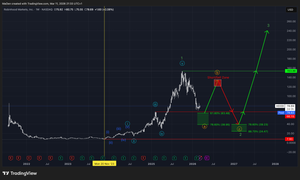
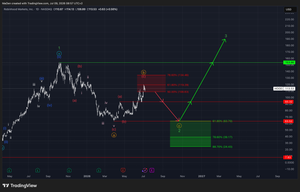
Robinhood has reached and activated our Fibonacci retracement zone (marked in red). This zone represents selling or shorting opportunities for this market, as we expect Robinhood to complete its short-term recovery phase within orange wave B and subsequently begin a new sell-off driven by bearish control and momentum.
Short Entry Levels:
- 50% at $108.63
- 61.8% at $119.29
- 78.6% at $134.46
Stop Loss: 1% above the zone at $135.84
Once Robinhood leaves our defined zone to the downside and breaks below $93.32, we will be able to validate this zone. Following that, we primarily expect this stock to drop into our long-term Fibonacci retracement zone (marked in green). This zone represents clear long-term buying opportunities, as we expect the current correction to conclude within it.
Long Entry Levels:
- 61.8% at $63.70
- 78.6% at $39.17
- 88.7% at $24.43
Stop Loss: 1% below the zone at $24.17
Should anything change with this stock, or once Robinhood validates the currently active Fibonacci zone, we will update you immediately.
Kind regards,
Monalytics
DISCLAIMER: The content on this website, including charts, analyses, and recommendations, is for informational purposes only and does not constitute financial, investment, or professional advice. Trading and investing involve risk. You should consult a qualified financial advisor before making any investment decisions.