SAP SE (SAP) EW-Analysis
SAP is already in its long-term correction.
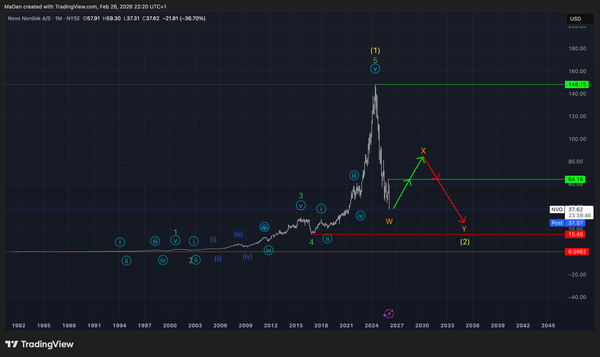
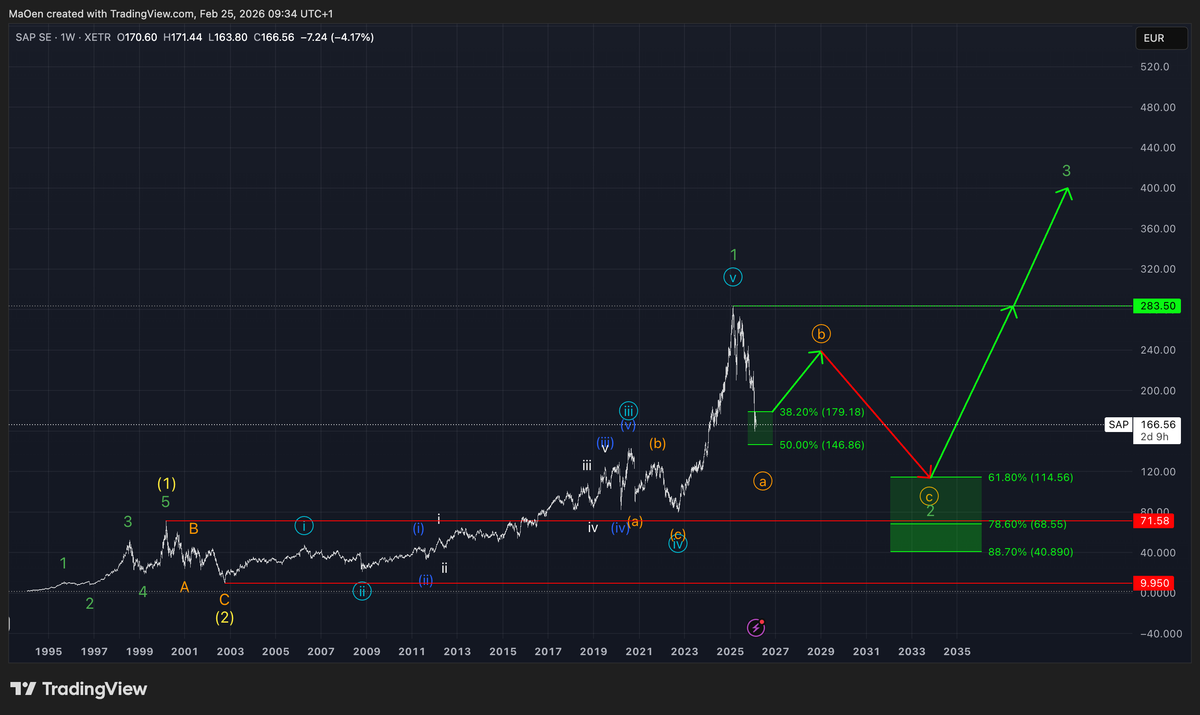
In 2000, SAP built Yellow Wave 1 and completed the corrective Yellow Wave 2 in 2003. This impulsive structure laid the foundation for a large overarching bull run. After the completion of this Yellow 1–2 setup, SAP delivered a strong and sustained performance over the following years.
We currently expect SAP to have topped out and marked its all-time high at $283.50 as the major bull market high for this stock. The completion of this all-time high is labeled as Green Wave 1.
The current sell-off can be interpreted as the first stages of an a–b–c corrective structure forming Green Wave 2.
We expect this Green 1–2 setup to develop over the coming months before the stock resumes its long-term bullish outlook with new impulsive movements into long-term Green Wave 3.
We anticipate that the current correction into Green Wave 2 has already begun. For this scenario, we have defined two Fibonacci retracement zones.
First Fibonacci Retracement Zone:
38.2% at $179.18
50.0% at $146.86
SAP is currently trading within this zone.
We expect SAP to complete bearish Orange Wave a within this range and then regain short-term bullish momentum to build Orange Wave b. If this zone holds and can be confirmed as successful support, Orange Wave b should represent a short-term recovery from the sell-off, before a final and stronger decline occurs in Orange Wave c.
Orange Wave c would represent the final stage of the entire correction and would complete Green Wave 2.
Second Fibonacci Retracement Zone:
61.8% at $114.56
78.6% at $68.55
88.7% at $40.89
This zone marks the projected end of the long-term correction.
Within this range, Green Wave 2 should be completed, and SAP is expected to regain strong bullish momentum for new long-term impulsive movements into Green Wave 3.
From our point of view, this zone represents the ideal opportunity to buy or accumulate the stock.
If any structural changes occur or if one of our Fibonacci zones becomes activated or invalidated, we will update you immediately.
Kind regards,
Monalytics
DISCLAIMER: The content on this website, including charts, analyses, and recommendations, is for informational purposes only and does not constitute financial, investment, or professional advice. Trading and investing involve risk. You should consult a qualified financial advisor before making any investment decisions.