We are revising our count for this stock.
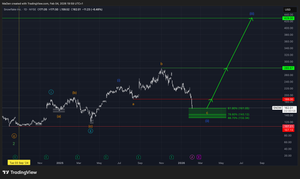
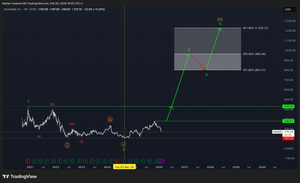
Initially, we expected Snowflake to have formed a major bottom and begun the first impulsive moves of a long-term uptrend. Based on this expectation, we defined a Fibonacci buying and accumulation zone (https://monalytics.org/snowflake-snow-ew-analysis/).
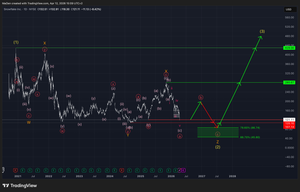
However, this scenario has now been invalidated. The price moved below the defined zone (marked in grey), breaking down through $120.10. This development invalidates our initial outlook and shifts focus to our secondary scenario.
We now expect the market to lose the current level around $121.11 and continue selling off toward new lows, ultimately forming a new bottom. The entire structure since the IPO is now interpreted as bearish, and we anticipate the potential for a new all-time low in Snowflake.
From an Elliott Wave perspective, the structure is counted as a W–X–Y–X–Z correction. The current decline represents the final leg of this formation, identified as orange wave Z. This wave is expected to unfold in a three-wave sequence: red wave A, B, and C.
In the near term, we anticipate a short recovery phase as part of red wave B, followed by a significant sell-off into red wave C, which should complete orange wave Z.
For this expected decline, we have identified a new Fibonacci retracement zone. This zone offers attractive levels for accumulation. If you are not yet positioned, it provides potential entry opportunities. If you are already holding a position based on the previous Fibonacci buying zone, this new zone presents an optimal opportunity to reduce your dollar-cost average (DCA) and manage your position more effectively.
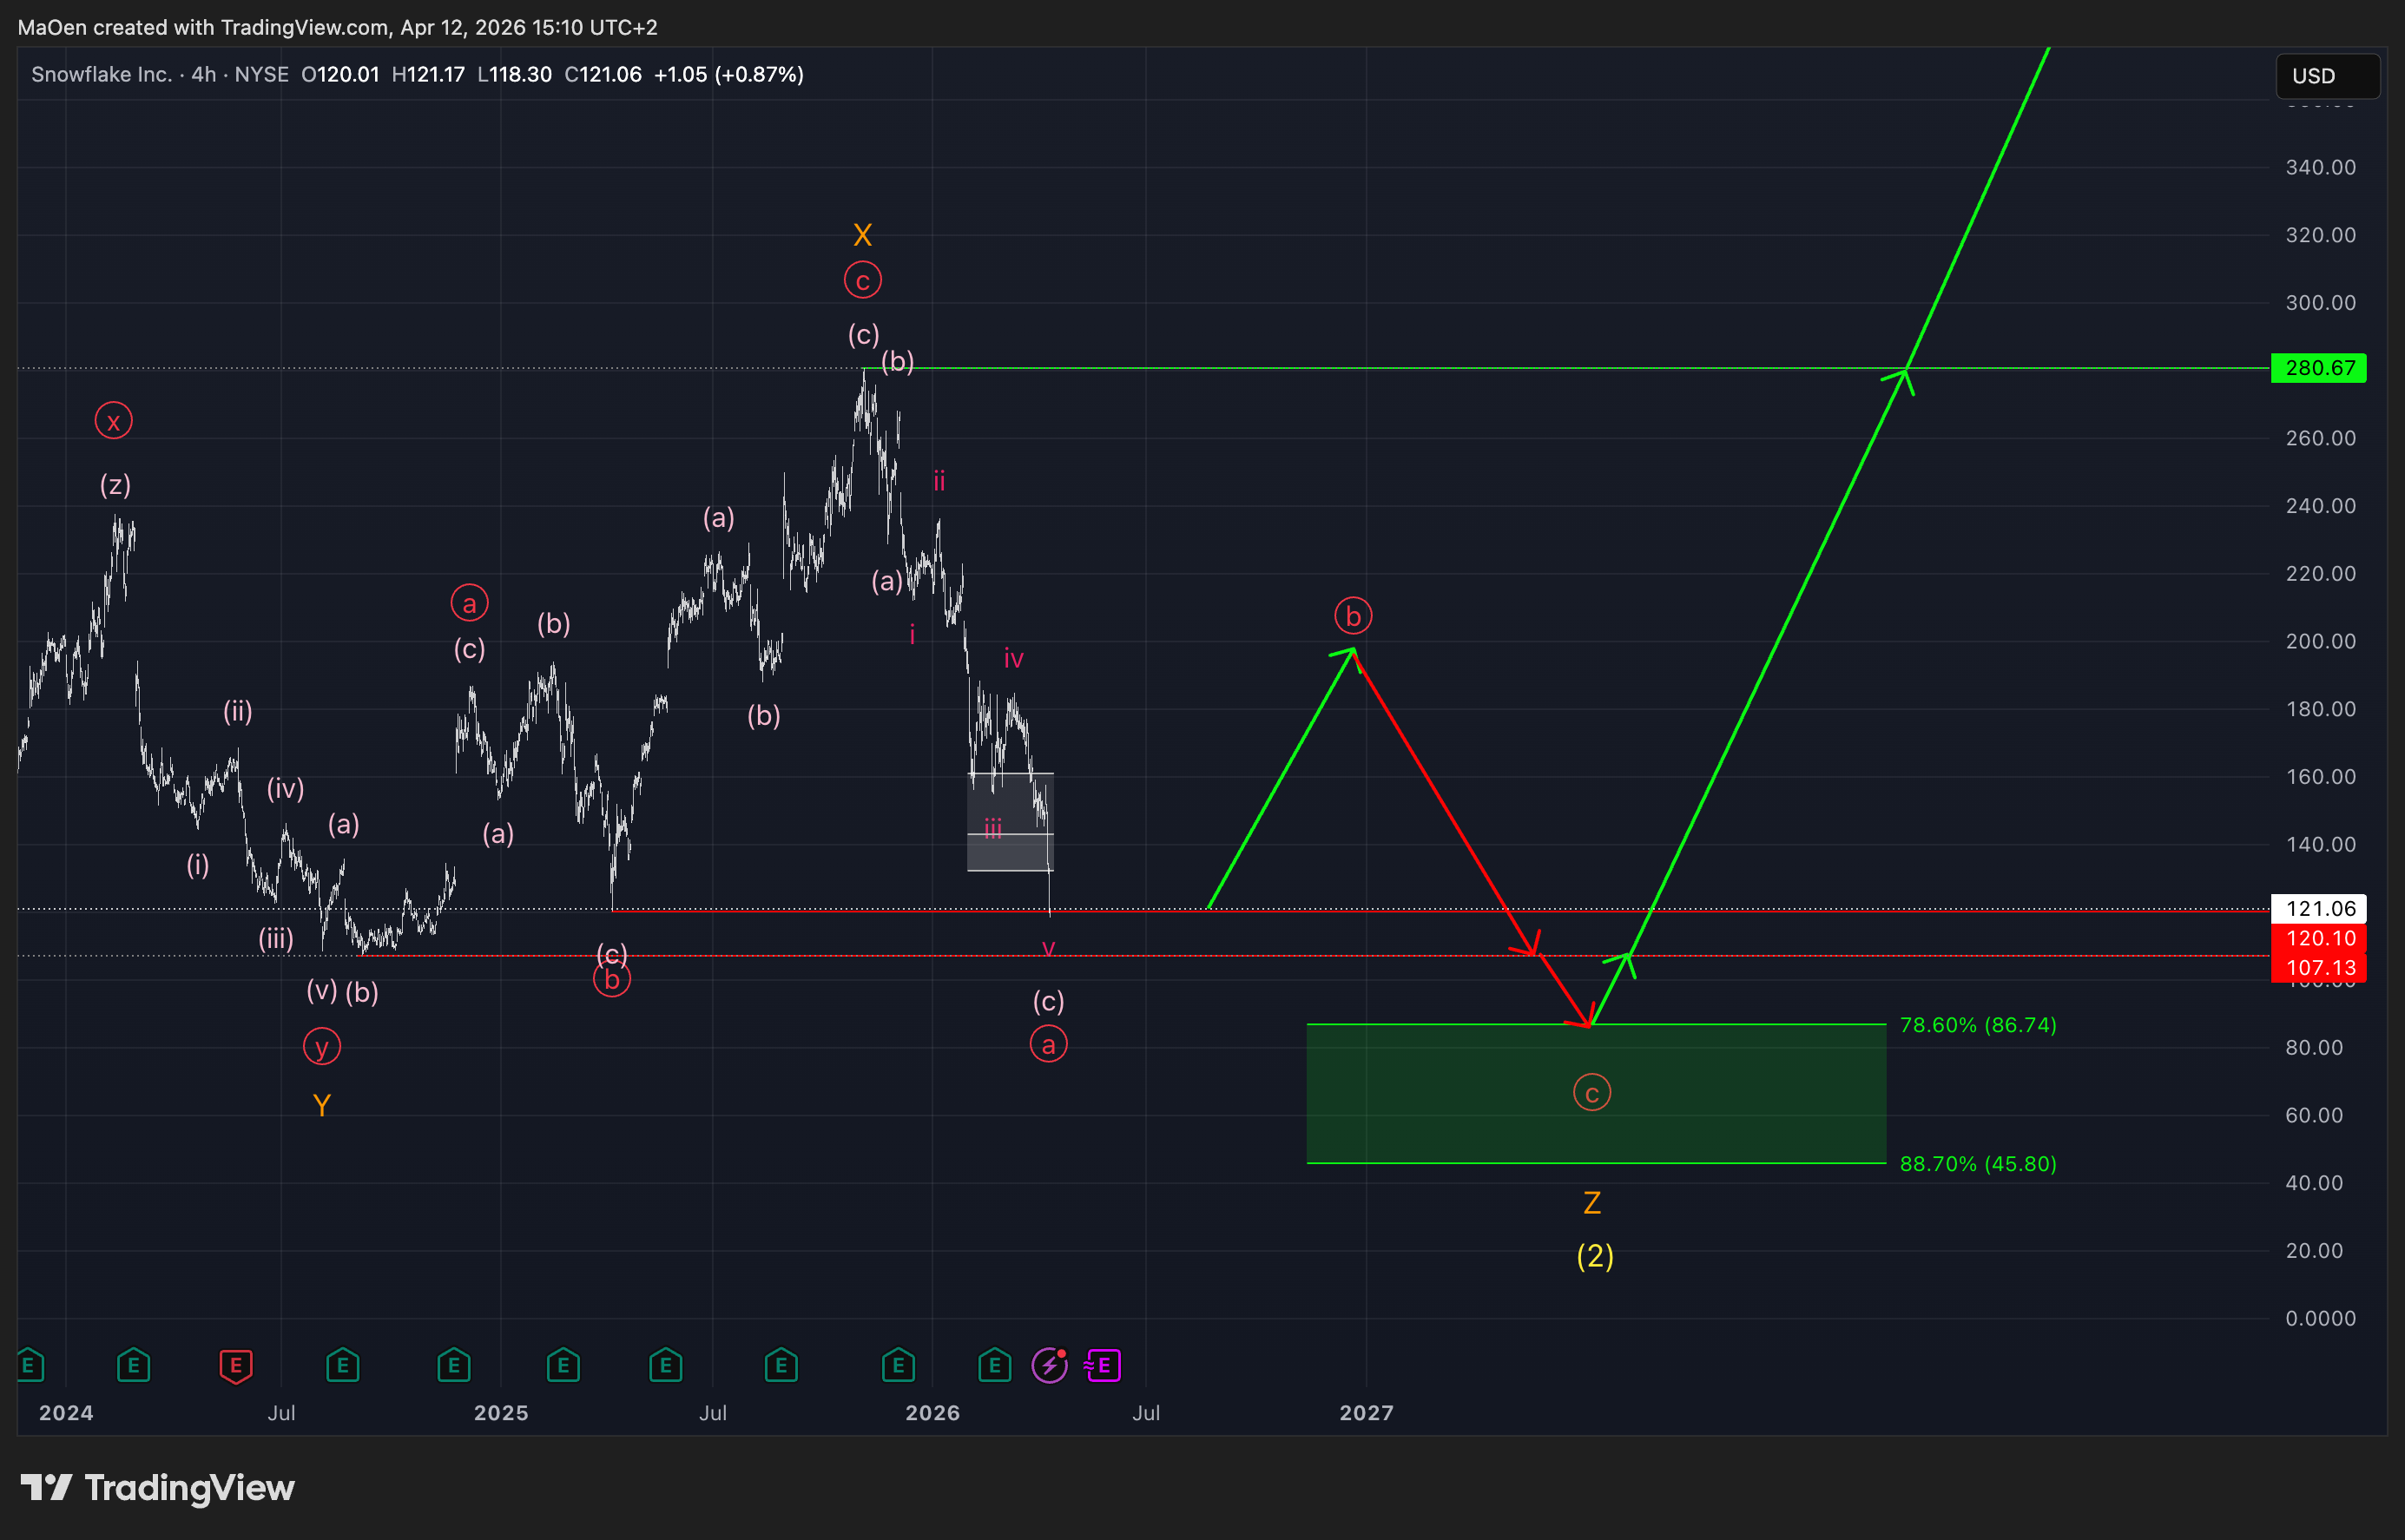
The Fibonacci retracement zone is defined as follows:
78.6% at $86.74
88.7% at $45.80
Within this zone, we expect the market to complete its bearish structure and initiate long-term impulsive moves, forming a healthy and sustainable uptrend. We anticipate that this zone will hold, allowing bullish momentum to re-enter the market. From there, the stock is expected to rise back above $120.10 and continue higher over time, potentially moving toward its all-time high in a long-term process beginning from this Fibonacci retracement zone.
Our previous Fibonacci retracement zone from the earlier long-term outlook has failed. However, this does not necessarily mean that existing positions will result in losses. We expect the stock to form its historical bottom in the near future and, regardless of whether the final structure is slightly bearish or already bullish, begin to establish new upward price movements.
If any structural changes occur or our Fibonacci retracement zone is activated, we will update you immediately.
Kind regards,
Monalytics
DISCLAIMER: The content on this website, including charts, analyses, and recommendations, is for informational purposes only and does not constitute financial, investment, or professional advice. Trading and investing involve risk. You should consult a qualified financial advisor before making any investment decisions.