UnitedHealth Group (UNH) EW-Analysis
This stock presents a significant long-term opportunity.
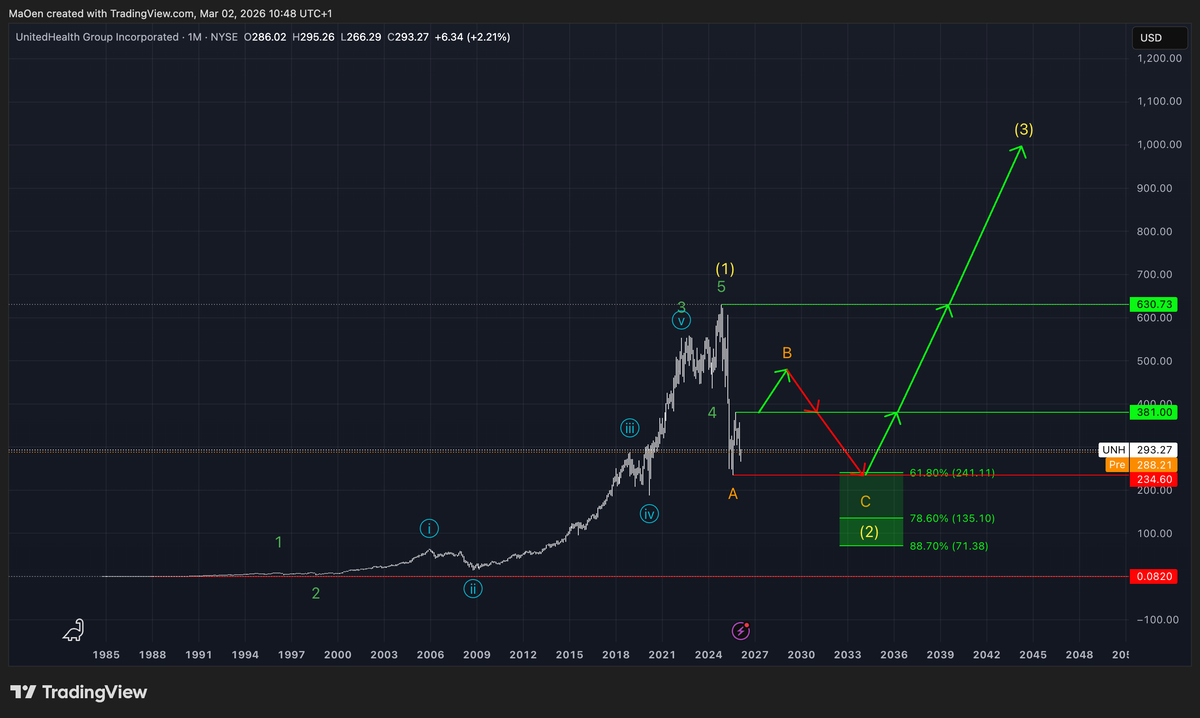
Since its IPO on October 26, 1984, UnitedHealth Group has developed a technically compelling price structure. The long-term green cycle initiated a sustained bullish phase for the stock. After the completion of bullish green wave 5, this cycle concluded and transitioned into yellow wave 1 of a higher degree.
Yellow wave 1 marked a major long-term cycle high at the current all-time high of $630.73. From that level, the market initiated a substantial sell-off, signaling the early stages of a long-term corrective phase — bearish yellow wave 2.
The initial decline formed orange wave a. Subsequently, the market entered a recovery phase, developing orange wave b. If orange wave b has completed its recovery structure, we expect a final significant sell-off forming orange wave c. This move should establish new lows and complete the broader correction, thereby terminating both orange wave c and yellow wave 2.
To identify potential termination levels for this correction, we have defined a long-term Fibonacci retracement zone. Within this zone, we anticipate a structural shift from long-term bearish sentiment to renewed, sustainable bullish momentum. The zone spans the following retracement levels:
- 61.8% at $241.11
- 78.6% at $135.10
- 88.7% at $71.38
If price action reaches and stabilizes within this Fibonacci retracement zone, we expect the corrective phase to conclude and a new long-term bullish cycle to begin — initiating the early stages of bullish yellow wave 3. For this reason, we view this retracement zone as a prime long-term accumulation area.
At present, the stock remains in a short-term recovery phase, building orange wave b. A decisive sell-off below the local low of orange wave a at $234.60 would confirm the continuation of the corrective structure. Once this move unfolds and the correction approaches its terminal zone, we expect the stock to transition back into sustainable bullish momentum and re-enter a long-term uptrend.
Should structural changes occur or the Fibonacci retracement zone become activated, we will provide an immediate update.
Kind regards,
Monalytics
DISCLAIMER: The content on this website, including charts, analyses, and recommendations, is for informational purposes only and does not constitute financial, investment, or professional advice. Trading and investing involve risk. You should consult a qualified financial advisor before making any investment decisions.