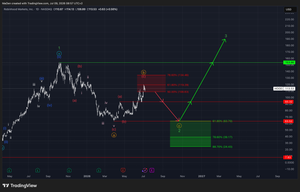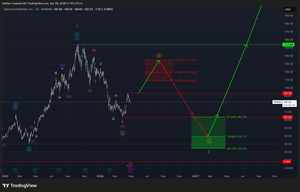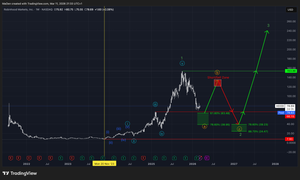
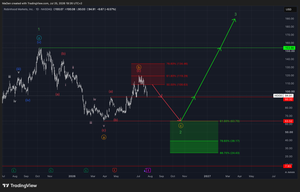
Robinhood has successfully left our Fibonacci retracement zone, which we outlined as a selling zone. Within this zone, we expected the market to lose its current bullish momentum and form orange wave B. This zone proved to be a perfect opportunity to either realize gains from long positions or to purchase a put option on this stock.
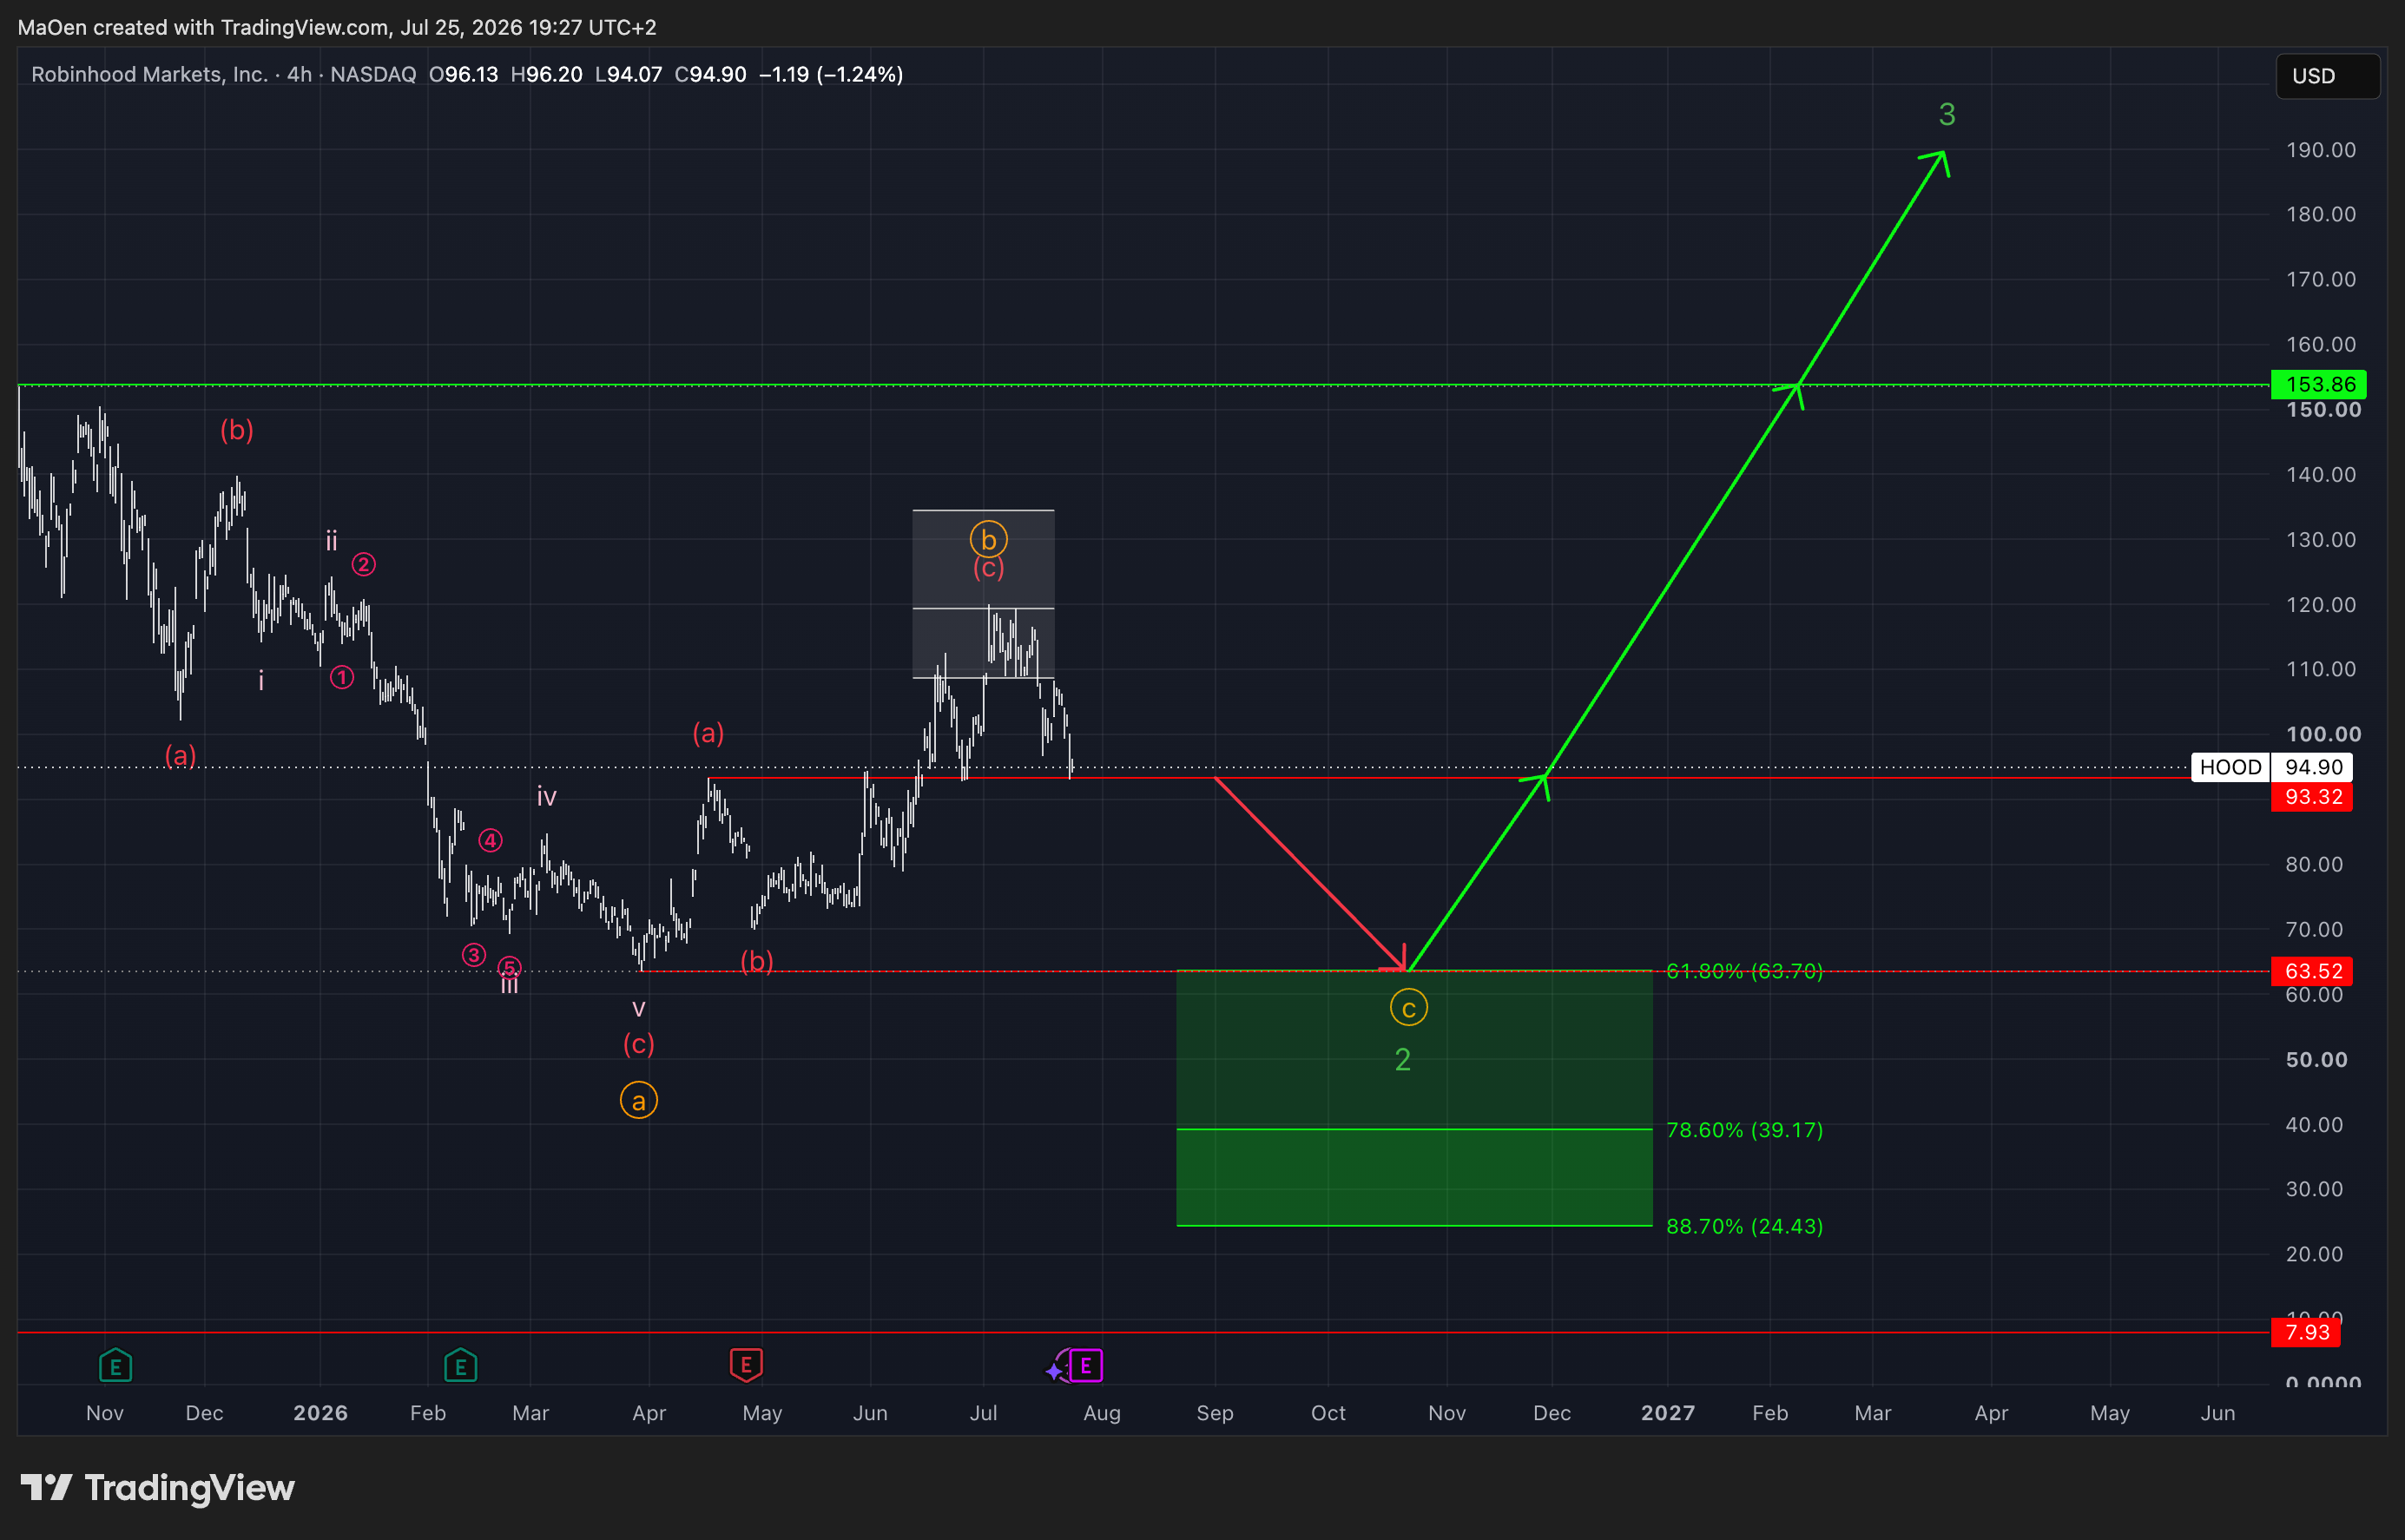
We outlined that this zone would be validated as soon as the market breaks below $93.32 — and with that level breached, we have successfully validated and deactivated this zone.
We now expect the market to break down and reach our long-term Fibonacci retracement zone, which represents a prime long-term buying opportunity.
Long Entry Levels:
- 61.8% at $63.70
- 78.6% at $39.17
- 88.7% at $24.43
Once this Fibonacci retracement zone is reached, it will be the ideal moment to close or exit a short position or put option.
Should anything happen with this stock, we will update you immediately.
Kind regards,
Monalytics
DISCLAIMER: The content on this website, including charts, analyses, and recommendations, is for informational purposes only and does not constitute financial, investment, or professional advice. Trading and investing involve risk. You should consult a qualified financial advisor before making any investment decisions.